Introduction to Boosting
This module introduces the concept of boosting, an ensemble learning technique in which weak learners are combined together by using weights. This iterative process is continued by modifying the weights to emphasize inaccurate predictions, which can then be better predicted in future iterations.
Objectives
By the end of this lesson, you will be able to
- explain the concept of boosting,
- articulate the benefits of using boosting, and how it differs from bagging, and
- apply boosting algorithms, such as the gradient boosted decision tree
Boosting
The decision tree is one of the simplest machine learning algorithms to understand. Simple to develop and easy to apply, they quickly became a popular machine learning tool. However, they can be prone to overfitting the data, especially when they become too large. As a result, ensemble techniques were developed that combined the predictions from many decision trees, that in general are small and might be trained only on a fraction of the data, to make a more powerful meta-estimator.
In the Bagging lesson, we explored the concept of bagging, which can be used to construct one type of ensemble estimator. Bagging employs bootstrap aggregation to first create samples of the original data set, which are each used to construct a weak learner, generally by using a decision tree. Finally, these weak learners are aggregated together to make a more powerful predictor.
In this module, we introduce a second approach, known as boosting, where many weak learners, for example, very shallow decision trees (also known as tree stumps), are trained. The predictions from these weak learners are combined together, for example, by majority voting, and the results are used to generate weights for the input training data. These weights are used by the boosting algorithm to emphasize instances that are incorrectly predicted, and to deemphasize instances that are correctly predicted. This process continues iteratively, during which the weak learners eventually become more accurate.
I introduce two algorithms that implement boosting: Gradient Tree Boosting and Adaboost. For space considerations, we focus most of the module on effectively using Gradient Boosted Trees (GBT). First, we demonstrate this algorithm on the Iris classification task, which also allows us to demonstrate how this algorithm can be used to compute feature importances, as well as use decision surfaces to explore different hyperparameters. Finally, the Adaboost algorithm is quickly presented by applying it to these same data sets.
Throughout this module, you should think about how these results from boosting are different than the results from the other algorithms, in particular the bagging algorithms introduced in a different module. You also should explore how changes in the default hyperparameter values affect the performance of this algorithm.
Formalism
While there are a number of different boosting algorithms two of the more popular ones are the Adaboost algorithm, which is short for adaptive boosting, and the Gradient Tree Boosting algorithm. The Adaboost algorithm works as the earlier boosting description outlined. Weights are generated in each iteration and used to improve the overall prediction of the aggregated weak learners. The Gradient Tree Boosting algorithm extends this to support arbitrary cost (or loss) functions, beyond the minimization of the deviation between predicted and actual labels (classification), or least squares (regression).
These two algorithms will both be explored in this module, although most of the module focuses on the Gradient Tree Boosting, with the Adaboost algorithm presented at the end for comparison purposes. The construction of the individual base learners is based on a permutation of the features when determining the best split. Thus, the individual learners can be different, even if they are constructed by using all of the training data. These and other characteristics of the Gradient Tree Boosting algorithm are controlled by a set of hyperparameters, many of which are the same as for bagging estimators. Some of the more useful hyperparameters include:
- n.trees
Integer specifying the total number of trees to fit. This is equivalent to the number of iterations and the number of basis functions in the additive expansion. Default is 100.
- interaction.depth
Integer specifying the maximum depth of each tree (i.e., the highest level of variable interactions allowed). A value of 1 implies an additive model, a value of 2 implies a model with up to 2-way interactions, etc. Default is 1.
- n.minobsinnode
Integer specifying the minimum number of observations in the terminal nodes of the trees. Note that this is the actual number of observations, not the total weight.
- shrinkage
a shrinkage parameter applied to each tree in the expansion. Also known as the learning rate or step-size reduction; 0.001 to 0.1 usually work, but a smaller learning rate typically requires more trees. Default is 0.1.
Classification: Iris Data
Here we go again 😆
library(tidyverse)
set.seed(1)
#lets split the data 60/40
library(caret)
trainIndex <- createDataPartition(iris$Species, p = .6, list = FALSE, times = 1)
#grab the data
irisTrain <- iris[ trainIndex,]
irisTest <- iris[-trainIndex,]
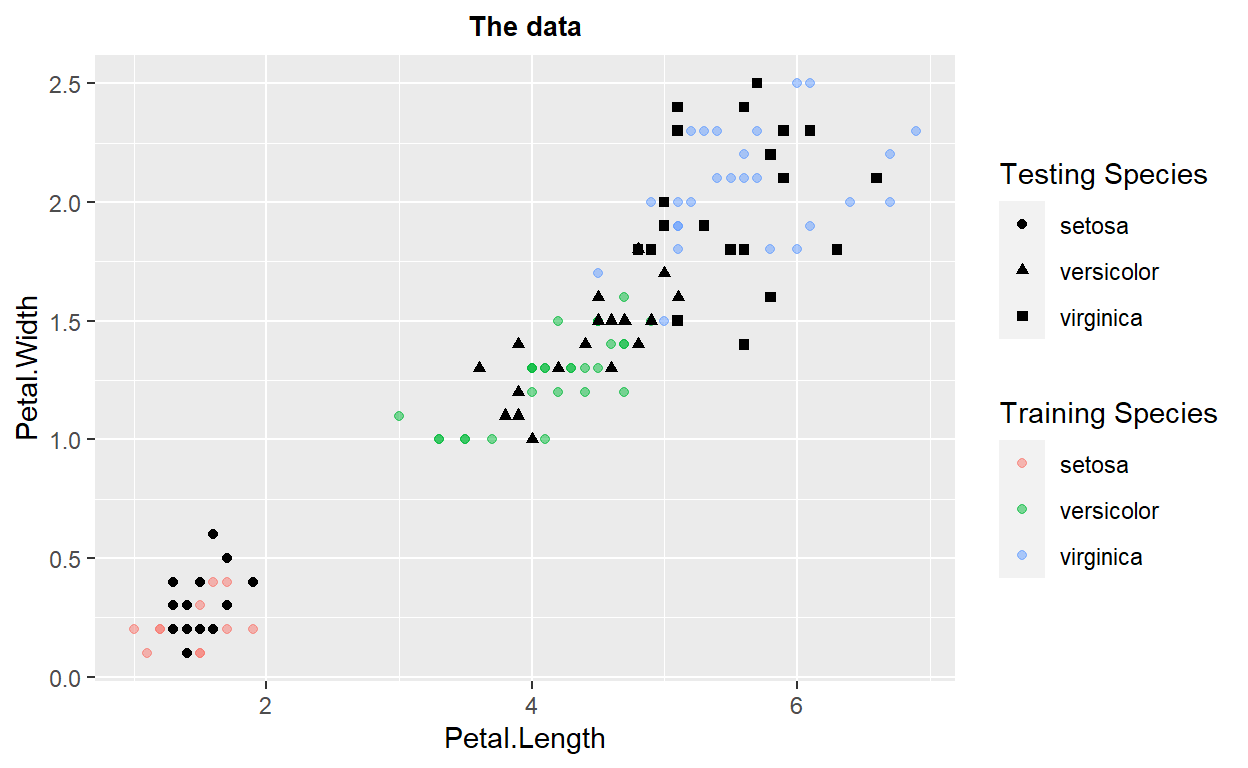
ggplot(data=irisTrain)+geom_point(mapping = aes(x=Petal.Length,y=Petal.Width,color=Species),alpha=0.5) + labs(color = "Training Species")+
geom_point(data=irisTest, ,mapping = aes(x=Petal.Length,y=Petal.Width,shape=Species)) + labs(shape = "Testing Species") +
ggtitle("The data")+
theme(plot.title = element_text(hjust=0.5, size=10, face='bold'))
The Model
set.seed(1)
#added something here
IrisXGB<- train(
form = factor(Species) ~ .,
data = irisTrain,
#here we add classProbs because we want probs
trControl = trainControl(method = "cv", number = 10,
classProbs = TRUE),
method = "gbm",
tuneLength = 20,
#add this please
verbose=FALSE)
#IrisXGB
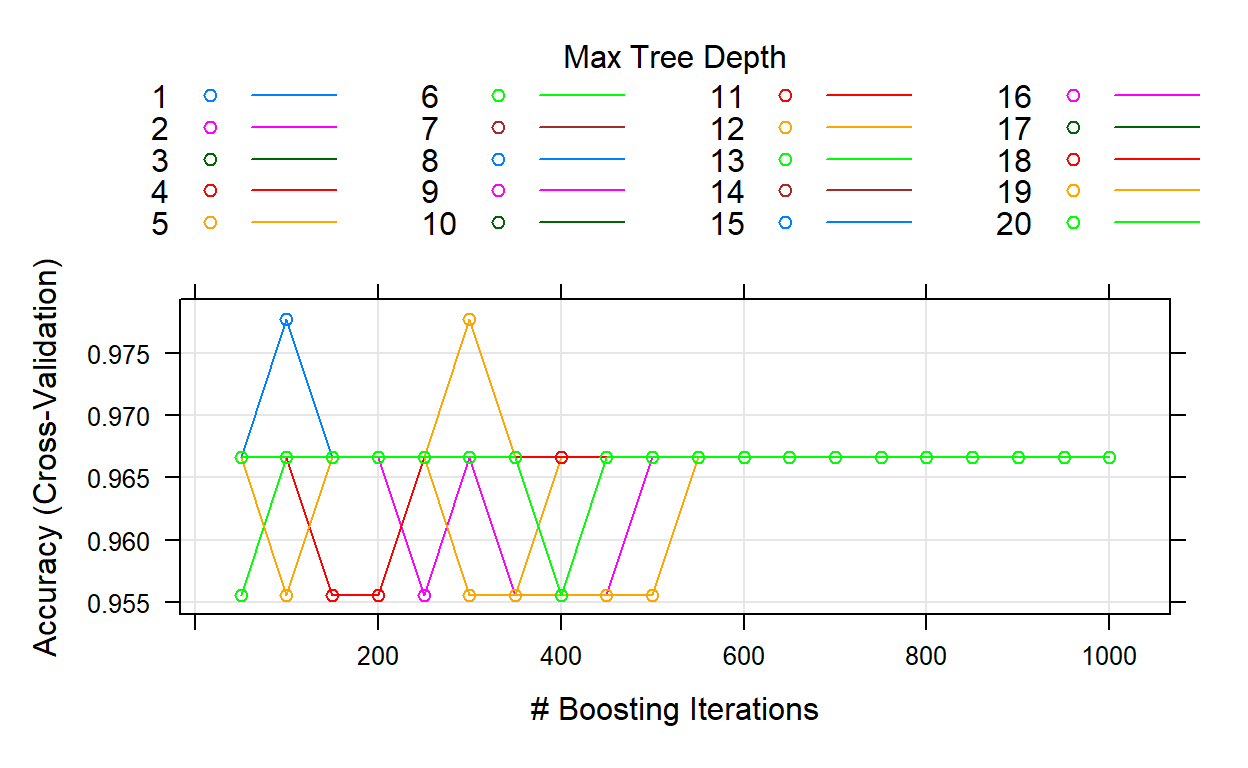
knitr::kable(IrisXGB$bestTune)
| n.trees | interaction.depth | shrinkage | n.minobsinnode | |
|---|---|---|---|---|
| 142 | 100 | 8 | 0.1 | 10 |
plot(IrisXGB)
IrisXGB_Pred<-predict(IrisXGB,irisTest,type="prob")

knitr::kable(IrisXGB_Pred)%>%
  kableExtra::kable_styling("striped")%>%
  kableExtra::scroll_box(width = "50%",height="300px")
| setosa | versicolor | virginica |
|---|---|---|
| 0.9999999 | 0.0000001 | 0.0000001 |
| 1.0000000 | 0.0000000 | 0.0000000 |
| 1.0000000 | 0.0000000 | 0.0000000 |
| 0.9999999 | 0.0000000 | 0.0000000 |
| 0.9999999 | 0.0000001 | 0.0000001 |
| 0.9999604 | 0.0000391 | 0.0000005 |
| 0.9999998 | 0.0000002 | 0.0000000 |
| 0.9998762 | 0.0001231 | 0.0000007 |
| 0.9999996 | 0.0000004 | 0.0000000 |
| 1.0000000 | 0.0000000 | 0.0000000 |
| 0.9999999 | 0.0000000 | 0.0000001 |
| 0.9999998 | 0.0000002 | 0.0000000 |
| 0.9999999 | 0.0000000 | 0.0000000 |
| 0.9999993 | 0.0000007 | 0.0000000 |
| 1.0000000 | 0.0000000 | 0.0000000 |
| 0.9956348 | 0.0023072 | 0.0020580 |
| 0.9999999 | 0.0000001 | 0.0000001 |
| 0.9999996 | 0.0000004 | 0.0000000 |
| 0.9999995 | 0.0000004 | 0.0000001 |
| 1.0000000 | 0.0000000 | 0.0000000 |
| 0.0000146 | 0.2480013 | 0.7519840 |
| 0.0000000 | 0.9999999 | 0.0000000 |
| 0.0000000 | 1.0000000 | 0.0000000 |
| 0.0000004 | 0.9999952 | 0.0000044 |
| 0.0000001 | 0.9999883 | 0.0000116 |
| 0.0000000 | 0.9999998 | 0.0000001 |
| 0.0000000 | 1.0000000 | 0.0000000 |
| 0.0000001 | 0.9999947 | 0.0000053 |
| 0.0000003 | 0.0000695 | 0.9999302 |
| 0.0000000 | 1.0000000 | 0.0000000 |
| 0.0000007 | 0.9994671 | 0.0005322 |
| 0.0000001 | 0.0000253 | 0.9999747 |
| 0.0000001 | 0.9999972 | 0.0000028 |
| 0.0000001 | 0.9999976 | 0.0000023 |
| 0.0000001 | 0.0000211 | 0.9999788 |
| 0.0000709 | 0.9999073 | 0.0000218 |
| 0.0000101 | 0.9966311 | 0.0033587 |
| 0.0000000 | 0.9999997 | 0.0000003 |
| 0.0000001 | 0.9999953 | 0.0000046 |
| 0.0000001 | 0.9999996 | 0.0000004 |
| 0.0000000 | 0.0000017 | 0.9999983 |
| 0.0000000 | 0.0000106 | 0.9999893 |
| 0.0000000 | 0.0000017 | 0.9999983 |
| 0.0000000 | 0.0000017 | 0.9999983 |
| 0.0000000 | 0.0000038 | 0.9999962 |
| 0.0000002 | 0.0002156 | 0.9997843 |
| 0.0000000 | 0.0000008 | 0.9999992 |
| 0.0000000 | 0.0000001 | 0.9999999 |
| 0.0000015 | 0.0245239 | 0.9754746 |
| 0.0000009 | 0.0048799 | 0.9951192 |
| 0.0000004 | 0.0001712 | 0.9998285 |
| 0.0000099 | 0.1688174 | 0.8311727 |
| 0.0000009 | 0.0007682 | 0.9992310 |
| 0.0000000 | 0.0000017 | 0.9999983 |
| 0.0000000 | 0.0000034 | 0.9999966 |
| 0.0000000 | 0.0000031 | 0.9999969 |
| 0.0000000 | 0.0000040 | 0.9999960 |
| 0.0000000 | 0.0000013 | 0.9999987 |
| 0.0000000 | 0.0000013 | 0.9999987 |
| 0.0000002 | 0.0003979 | 0.9996019 |
irisXGBtestpred<-cbind(IrisXGB_Pred,irisTest)

irisXGBtestpred<-irisXGBtestpred%>%
  mutate(prediction=if_else(setosa>versicolor & setosa>virginica,"setosa",
                            if_else(versicolor>setosa & versicolor>virginica, "versicolor",
                                    if_else(virginica>setosa & virginica>versicolor,"virginica", "PROBLEM"))))

table(irisXGBtestpred$prediction)
    setosa versicolor  virginica
20 16 24 XgbConfusion<-confusionMatrix(factor(irisXGBtestpred$prediction),factor(irisXGBtestpred$Species))
XgbConfusion
Confusion Matrix and Statistics
Reference
Prediction setosa versicolor virginica
setosa 20 0 0
versicolor 0 16 0
virginica 0 4 20
Overall Statistics
Accuracy : 0.9333
95% CI : (0.838, 0.9815)
No Information Rate : 0.3333
P-Value [Acc > NIR] : < 2.2e-16
Kappa : 0.9
Mcnemar's Test P-Value : NA
Statistics by Class:
Class: setosa Class: versicolor Class: virginica
Sensitivity 1.0000 0.8000 1.0000
Specificity 1.0000 1.0000 0.9000
Pos Pred Value 1.0000 1.0000 0.8333
Neg Pred Value 1.0000 0.9091 1.0000
Prevalence 0.3333 0.3333 0.3333
Detection Rate 0.3333 0.2667 0.3333
Detection Prevalence 0.3333 0.2667 0.4000
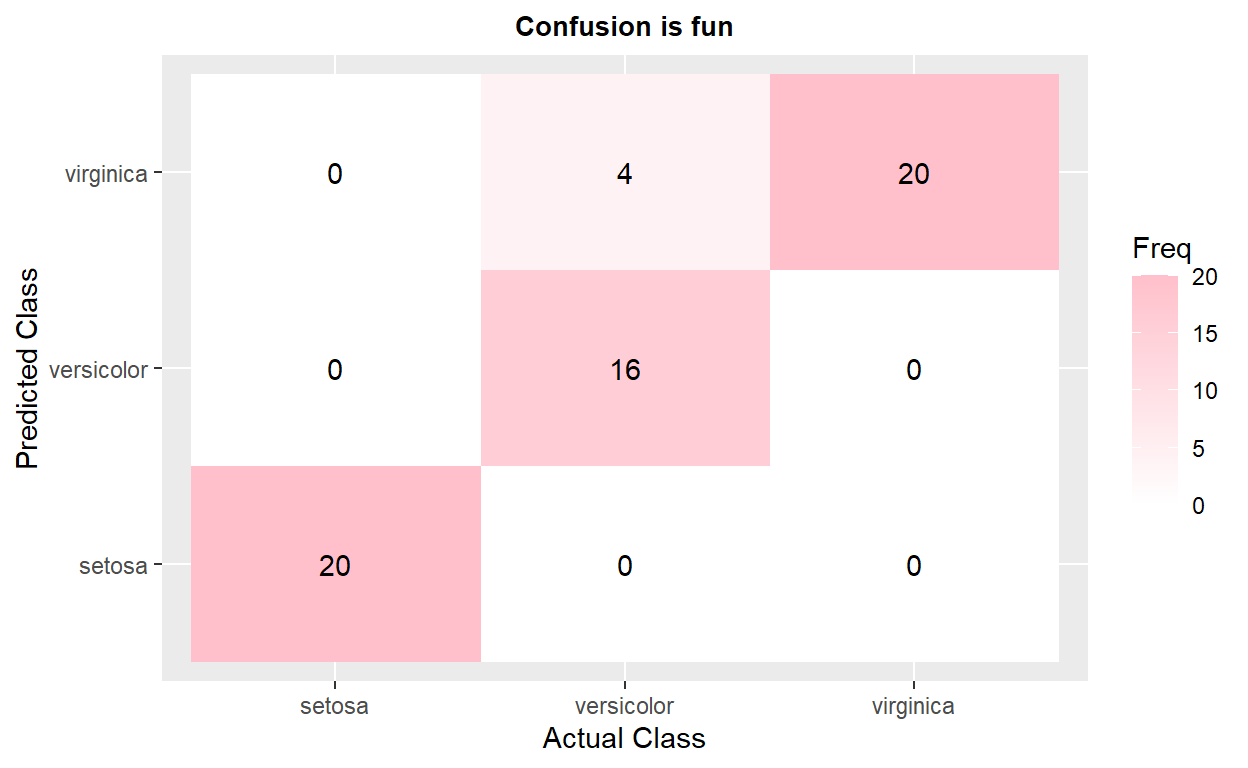
Balanced Accuracy 1.0000 0.9000 0.9500Lets have a little fun with ggplot and the confusion matrix 😈
ggplot(as.data.frame(XgbConfusion$table))+
  geom_raster(aes(x=Reference, y=Prediction, fill=Freq)) +
  geom_text(aes(x=Reference, y=Prediction, label=Freq)) +
   scale_fill_gradient2( low = "darkred", high = "pink", na.value="black", name = "Freq" )+
  scale_x_discrete(name="Actual Class") +
  scale_y_discrete(name="Predicted Class")+
  ggtitle("Confusion is fun")+
  theme(plot.title = element_text(hjust=0.5, size=10, face='bold'))
How did I figure out how to make the above graph? 🤔
Gradient Tree Boosting: Feature Importance
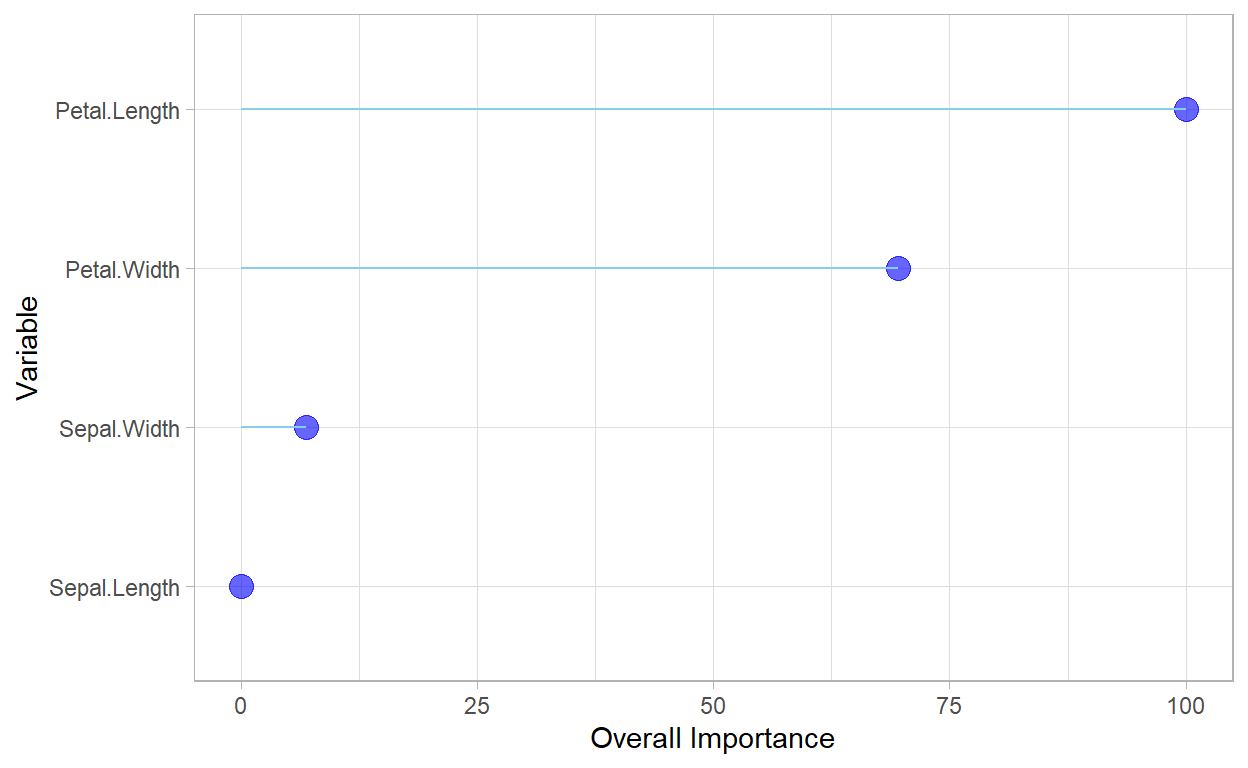
We can leverage the fact that the gradient tree boosting algorithm builds many weak learners and iteratively improves them to determine the importance of the different features. By default, these values simply encode the importance of a feature, where higher values are more important. We can take the ratio of these values, however, to compute a relative importance.
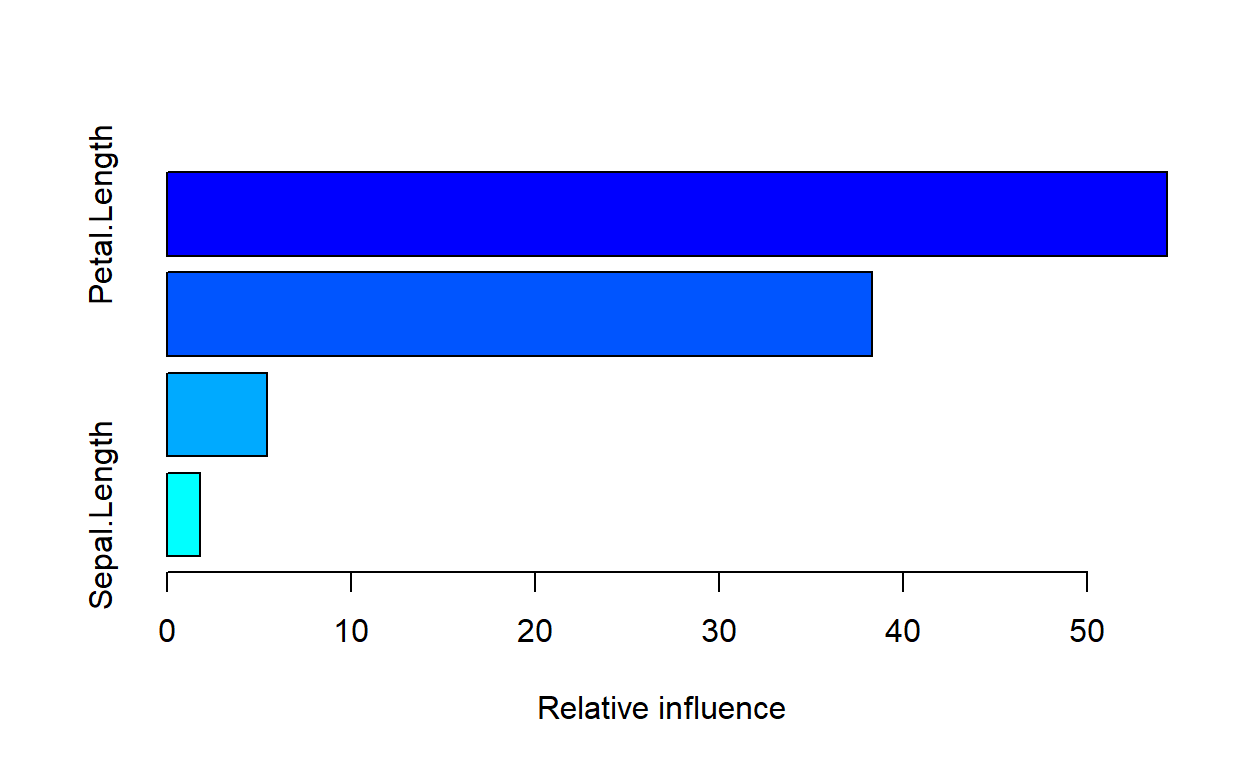
                      var   rel.inf
Petal.Length Petal.Length 54.367434
Petal.Width   Petal.Width 38.353661
Sepal.Width   Sepal.Width  5.463525
Sepal.Length Sepal.Length  1.815380
#had to add something
V<-caret::varImp(IrisXGB, n.trees=500)$importance%>%
arrange(desc(Overall))
knitr::kable(V)
| Overall | |
|---|---|
| Petal.Length | 100.000000 |
| Petal.Width | 69.527789 |
| Sepal.Width | 6.941965 |
| Sepal.Length | 0.000000 |
ggplot2::ggplot(V, aes(x=reorder(rownames(V),Overall), y=Overall)) +
geom_point( color="blue", size=4, alpha=0.6)+
geom_segment( aes(x=rownames(V), xend=rownames(V), y=0, yend=Overall),
color='skyblue') +
xlab('Variable')+
ylab('Overall Importance')+
theme_light() +
coord_flip()
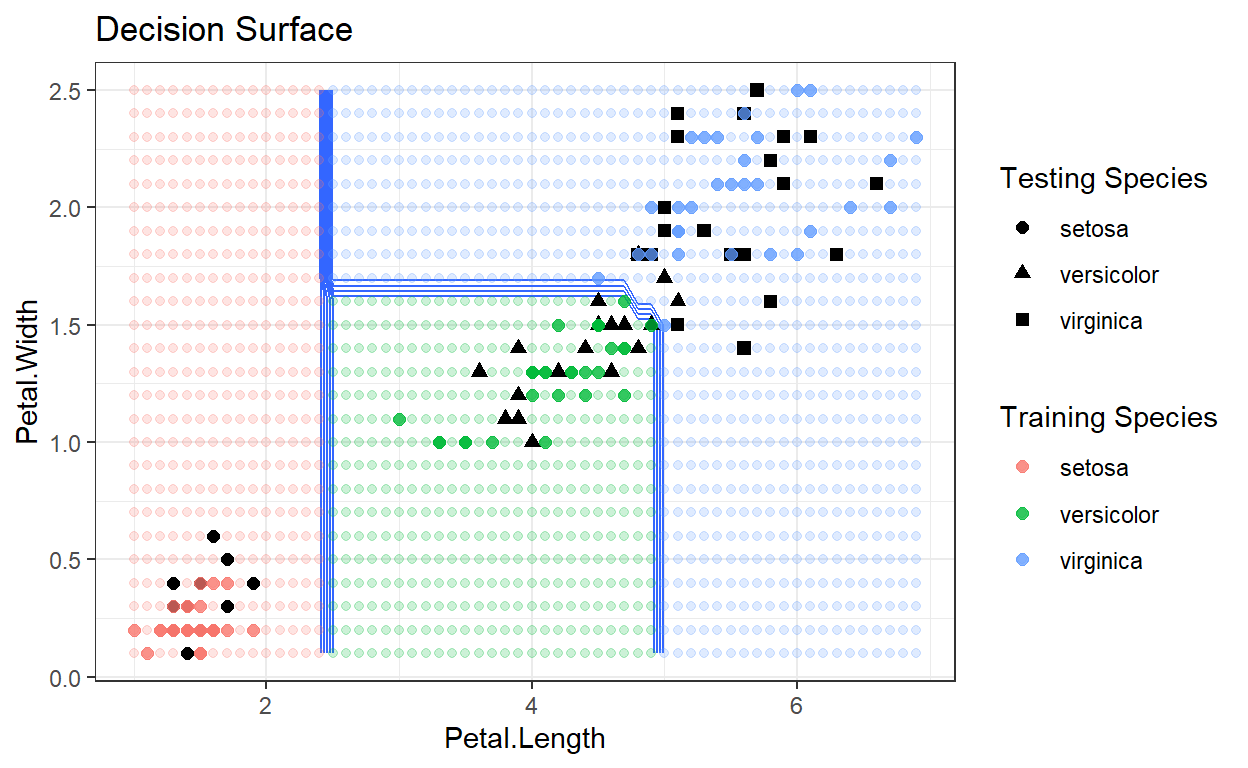
Gradient Tree Boosting: Decision Surface
set.seed(1)
#lets split the data 60/40
library(caret)
trainIndex <- createDataPartition(iris$Species, p = .6, list = FALSE, times = 1)

#grab the data
train <- iris[ trainIndex,]
test  <- iris[-trainIndex,]

mygrid<-expand.grid(interaction.depth = seq(2, 11, by = 2),
                        n.trees = seq(50, 250, by = 50),
                        n.minobsinnode = 10,
                        shrinkage = c(0.01, 0.1))

Irisgbm<- train(
  form = factor(Species) ~ .,
  data = train,
  #here we add classProbs because we want probs
  trControl = trainControl(method = "cv", number = 10,
                           classProbs =  TRUE),
  method = "gbm",
  tuneGrid = mygrid,
  verbose=FALSE)

knitr::kable(Irisgbm$bestTune)
| n.trees | interaction.depth | shrinkage | n.minobsinnode | |
|---|---|---|---|---|
| 26 | 50 | 2 | 0.1 | 10 |
pl = seq(min(iris$Petal.Length), max(iris$Petal.Length), by=0.1)
pw = seq(min(iris$Petal.Width), max(iris$Petal.Width), by=0.1)

# generates the boundaries for your graph
lgrid <- expand.grid(Petal.Length=pl,
                     Petal.Width=pw,
                     Sepal.Length = 5.4,
                     Sepal.Width=3.1)

IrisgbmGrid2 <- predict(Irisgbm, newdata=lgrid)
IrisgbmGrid <- as.numeric(IrisgbmGrid2)

# get the points from the test data...
testPred <- predict(Irisgbm, newdata=test)
testPred <- as.numeric(testPred)
# this gets the points for the testPred...
test$Pred <- testPred

probs <- matrix(IrisgbmGrid, length(pl), length(pw))

ggplot(data=lgrid) + stat_contour(aes(x=Petal.Length, y=Petal.Width, z=IrisgbmGrid),bins=10) +
  geom_point(aes(x=Petal.Length, y=Petal.Width, colour=IrisgbmGrid2),alpha=.2) +
  geom_point(data=test, aes(x=Petal.Length, y=Petal.Width, shape=Species), size=2) +
  labs(shape = "Testing Species") +
  geom_point(data=train, aes(x=Petal.Length, y=Petal.Width, color=Species), size=2, alpha=0.75)+
  theme_bw()+
  labs(color = "Training Species")+
  ggtitle("Decision Surface")
Exercise 1
- Use the tips data set and gradient boosting to predict
sex. Include a confusion matrix, roc curve, gain chart, and a lift chart. Look back at the random forest module for the roc, gain, and lift code. 👍 😄
Gradient Tree Boosting: Regression
We can also use gradient boosting to perform regression; however, in this case we attempt to create trees whose leaf nodes contain data that are nearby in the overall feature space. To predict a continuous value from a tree, we either have leaf nodes with only one feature, and use the relevant feature from that instance as our predictor, or we compute summary statistics from the instances in the appropriate leaf node, such as the mean or mode. The boosting algorithm combines these predictions together to (hopefully) make a more accurate estimator.
Lets get some more interesting data:
# install.packages("devtools")
# devtools::install_github("tyluRp/ucimlr")


knitr::kable(ucimlr::ucidata())%>%
  kableExtra::kable_styling("striped")%>%
  kableExtra::scroll_box(width = "100%",height="300px")
| name | type | task | variable_types | observations | variables | year |
|---|---|---|---|---|---|---|
| Abalone | Multivariate | Classification | Categorical, Integer, Real | 4177 | 8 | 1995 |
| Adult | Multivariate | Classification | Categorical, Integer | 48842 | 14 | 1996 |
| Annealing | Multivariate | Classification | Categorical, Integer, Real | 798 | 38 | NA |
| Anonymous Microsoft Web Data | NA | Recommender-Systems | Categorical | 37711 | 294 | 1998 |
| Arrhythmia | Multivariate | Classification | Categorical, Integer, Real | 452 | 279 | 1998 |
| Artificial Characters | Multivariate | Classification | Categorical, Integer, Real | 6000 | 7 | 1992 |
| Audiology (Original) | Multivariate | Classification | Categorical | 226 | NA | 1987 |
| Audiology (Standardized) | Multivariate | Classification | Categorical | 226 | 69 | 1992 |
| Auto MPG | Multivariate | Regression | Categorical, Real | 398 | 8 | 1993 |
| Automobile | Multivariate | Regression | Categorical, Integer, Real | 205 | 26 | 1987 |
| Badges | Univariate, Text | Classification | NA | 294 | 1 | 1994 |
| Balance Scale | Multivariate | Classification | Categorical | 625 | 4 | 1994 |
| Balloons | Multivariate | Classification | Categorical | 16 | 4 | NA |
| Breast Cancer | Multivariate | Classification | Categorical | 286 | 9 | 1988 |
| Breast Cancer Wisconsin (Original) | Multivariate | Classification | Integer | 699 | 10 | 1992 |
| Breast Cancer Wisconsin (Prognostic) | Multivariate | Classification, Regression | Real | 198 | 34 | 1995 |
| Breast Cancer Wisconsin (Diagnostic) | Multivariate | Classification | Real | 569 | 32 | 1995 |
| Pittsburgh Bridges | Multivariate | Classification | Categorical, Integer | 108 | 13 | 1990 |
| Car Evaluation | Multivariate | Classification | Categorical | 1728 | 6 | 1997 |
| Census Income | Multivariate | Classification | Categorical, Integer | 48842 | 14 | 1996 |
| Chess (King-Rook vs. King-Knight) | Multivariate, Data-Generator | Classification | Categorical, Integer | NA | 22 | 1988 |
| Chess (King-Rook vs. King-Pawn) | Multivariate | Classification | Categorical | 3196 | 36 | 1989 |
| Chess (King-Rook vs. King) | Multivariate | Classification | Categorical, Integer | 28056 | 6 | 1994 |
| Chess (Domain Theories) | Domain-Theory | NA | NA | NA | NA | NA |
| Bach Chorales | Univariate, Time-Series | NA | Categorical, Integer | 100 | 6 | NA |
| Connect-4 | Multivariate, Spatial | Classification | Categorical | 67557 | 42 | 1995 |
| Credit Approval | Multivariate | Classification | Categorical, Integer, Real | 690 | 15 | NA |
| Japanese Credit Screening | Multivariate, Domain-Theory | Classification | Categorical, Real, Integer | 125 | NA | 1992 |
| Computer Hardware | Multivariate | Regression | Integer | 209 | 9 | 1987 |
| Contraceptive Method Choice | Multivariate | Classification | Categorical, Integer | 1473 | 9 | 1997 |
| Covertype | Multivariate | Classification | Categorical, Integer | 581012 | 54 | 1998 |
| Cylinder Bands | Multivariate | Classification | Categorical, Integer, Real | 512 | 39 | 1995 |
| Dermatology | Multivariate | Classification | Categorical, Integer | 366 | 33 | 1998 |
| Diabetes | Multivariate, Time-Series | NA | Categorical, Integer | NA | 20 | NA |
| DGP2 - The Second Data Generation Program | Data-Generator | NA | Real | NA | NA | NA |
| Document Understanding | NA | NA | NA | NA | NA | 1994 |
| EBL Domain Theories | NA | NA | NA | NA | NA | NA |
| Echocardiogram | Multivariate | Classification | Categorical, Integer, Real | 132 | 12 | 1989 |
| Ecoli | Multivariate | Classification | Real | 336 | 8 | 1996 |
| Flags | Multivariate | Classification | Categorical, Integer | 194 | 30 | 1990 |
| Function Finding | NA | Function-Learning | Real | 352 | NA | 1990 |
| Glass Identification | Multivariate | Classification | Real | 214 | 10 | 1987 |
| Haberman’s Survival | Multivariate | Classification | Integer | 306 | 3 | 1999 |
| Hayes-Roth | Multivariate | Classification | Categorical | 160 | 5 | 1989 |
| Heart Disease | Multivariate | Classification | Categorical, Integer, Real | 303 | 75 | 1988 |
| Hepatitis | Multivariate | Classification | Categorical, Integer, Real | 155 | 19 | 1988 |
| Horse Colic | Multivariate | Classification | Categorical, Integer, Real | 368 | 27 | 1989 |
| ICU | Multivariate, Time-Series | NA | Real | NA | NA | NA |
| Image Segmentation | Multivariate | Classification | Real | 2310 | 19 | 1990 |
| Internet Advertisements | Multivariate | Classification | Categorical, Integer, Real | 3279 | 1558 | 1998 |
| Ionosphere | Multivariate | Classification | Integer, Real | 351 | 34 | 1989 |
| Iris | Multivariate | Classification | Real | 150 | 4 | 1988 |
| ISOLET | Multivariate | Classification | Real | 7797 | 617 | 1994 |
| Kinship | Relational | Relational-Learning | Categorical | 104 | 12 | 1990 |
| Labor Relations | Multivariate | NA | Categorical, Integer, Real | 57 | 16 | 1988 |
| LED Display Domain | Multivariate, Data-Generator | Classification | Categorical | NA | 7 | 1988 |
| Lenses | Multivariate | Classification | Categorical | 24 | 4 | 1990 |
| Letter Recognition | Multivariate | Classification | Integer | 20000 | 16 | 1991 |
| Liver Disorders | Multivariate | NA | Categorical, Integer, Real | 345 | 7 | 1990 |
| Logic Theorist | Domain-Theory | NA | NA | NA | NA | NA |
| Lung Cancer | Multivariate | Classification | Integer | 32 | 56 | 1992 |
| Lymphography | Multivariate | Classification | Categorical | 148 | 18 | 1988 |
| Mechanical Analysis | Multivariate | Classification | Categorical, Integer, Real | 209 | 8 | 1990 |
| Meta-data | Multivariate | Classification | Categorical, Integer, Real | 528 | 22 | 1996 |
| Mobile Robots | Domain-Theory | NA | Categorical, Integer, Real | NA | NA | 1995 |
| Molecular Biology (Promoter Gene Sequences) | Sequential, Domain-Theory | Classification | Categorical | 106 | 58 | 1990 |
| Molecular Biology (Protein Secondary Structure) | Sequential | Classification | Categorical | 128 | NA | NA |
| Molecular Biology (Splice-junction Gene Sequences) | Sequential, Domain-Theory | Classification | Categorical | 3190 | 61 | 1992 |
| MONK’s Problems | Multivariate | Classification | Categorical | 432 | 7 | 1992 |
| Moral Reasoner | Domain-Theory | NA | NA | 202 | NA | 1994 |
| Multiple Features | Multivariate | Classification | Integer, Real | 2000 | 649 | NA |
| Mushroom | Multivariate | Classification | Categorical | 8124 | 22 | 1987 |
| Musk (Version 1) | Multivariate | Classification | Integer | 476 | 168 | 1994 |
| Musk (Version 2) | Multivariate | Classification | Integer | 6598 | 168 | 1994 |
| Nursery | Multivariate | Classification | Categorical | 12960 | 8 | 1997 |
| Othello Domain Theory | Domain-Theory | NA | NA | NA | NA | 1991 |
| Page Blocks Classification | Multivariate | Classification | Integer, Real | 5473 | 10 | 1995 |
| Optical Recognition of Handwritten Digits | Multivariate | Classification | Integer | 5620 | 64 | 1998 |
| Pen-Based Recognition of Handwritten Digits | Multivariate | Classification | Integer | 10992 | 16 | 1998 |
| Post-Operative Patient | Multivariate | Classification | Categorical, Integer | 90 | 8 | 1993 |
| Primary Tumor | Multivariate | Classification | Categorical | 339 | 17 | 1988 |
| Prodigy | Domain-Theory | NA | NA | NA | NA | NA |
| Qualitative Structure Activity Relationships | Domain-Theory | NA | NA | NA | NA | NA |
| Quadruped Mammals | Multivariate, Data-Generator | Classification | Real | NA | 72 | 1992 |
| Servo | Multivariate | Regression | Categorical, Integer | 167 | 4 | 1993 |
| Shuttle Landing Control | Multivariate | Classification | Categorical | 15 | 6 | 1988 |
| Solar Flare | Multivariate | Regression | Categorical | 1389 | 10 | 1989 |
| Soybean (Large) | Multivariate | Classification | Categorical | 307 | 35 | 1988 |
| Soybean (Small) | Multivariate | Classification | Categorical | 47 | 35 | 1987 |
| Challenger USA Space Shuttle O-Ring | Multivariate | Regression | Integer | 23 | 4 | 1993 |
| Low Resolution Spectrometer | Multivariate | Classification | Integer, Real | 531 | 102 | 1988 |
| Spambase | Multivariate | Classification | Integer, Real | 4601 | 57 | 1999 |
| SPECT Heart | Multivariate | Classification | Categorical | 267 | 22 | 2001 |
| SPECTF Heart | Multivariate | Classification | Integer | 267 | 44 | 2001 |
| Sponge | Multivariate | Clustering | Categorical, Integer | 76 | 45 | NA |
| Statlog Project | NA | NA | NA | NA | NA | 1992 |
| Student Loan Relational | Domain-Theory | NA | NA | 1000 | NA | 1993 |
| Teaching Assistant Evaluation | Multivariate | Classification | Categorical, Integer | 151 | 5 | 1997 |
| Tic-Tac-Toe Endgame | Multivariate | Classification | Categorical | 958 | 9 | 1991 |
| Thyroid Disease | Multivariate, Domain-Theory | Classification | Categorical, Real | 7200 | 21 | 1987 |
| Trains | Multivariate | Classification | Categorical | 10 | 32 | 1994 |
| University | Multivariate | Classification | Categorical, Integer | 285 | 17 | 1988 |
| Congressional Voting Records | Multivariate | Classification | Categorical | 435 | 16 | 1987 |
| Water Treatment Plant | Multivariate | Clustering | Integer, Real | 527 | 38 | 1993 |
| Waveform Database Generator (Version 1) | Multivariate, Data-Generator | Classification | Real | 5000 | 21 | 1988 |
| Waveform Database Generator (Version 2) | Multivariate, Data-Generator | Classification | Real | 5000 | 40 | 1988 |
| Wine | Multivariate | Classification | Integer, Real | 178 | 13 | 1991 |
| Yeast | Multivariate | Classification | Real | 1484 | 8 | 1996 |
| Zoo | Multivariate | Classification | Categorical, Integer | 101 | 17 | 1990 |
| Undocumented | NA | NA | NA | NA | NA | NA |
| Twenty Newsgroups | Text | NA | NA | 20000 | NA | 1999 |
| Australian Sign Language signs | Multivariate, Time-Series | Classification | Categorical, Real | 6650 | 15 | 1999 |
| Australian Sign Language signs (High Quality) | Multivariate, Time-Series | Classification | Real | 2565 | 22 | 2002 |
| US Census Data (1990) | Multivariate | Clustering | Categorical | 2458285 | 68 | NA |
| Census-Income (KDD) | Multivariate | Classification | Categorical, Integer | 299285 | 40 | 2000 |
| Coil 1999 Competition Data | Multivariate | NA | Categorical, Real | 340 | 17 | 1999 |
| Corel Image Features | Multivariate | NA | Real | 68040 | 89 | 1999 |
| E. Coli Genes | Relational | NA | NA | NA | NA | 2001 |
| EEG Database | Multivariate, Time-Series | NA | Categorical, Integer, Real | 122 | 4 | 1999 |
| El Nino | Spatio-temporal | NA | Integer, Real | 178080 | 12 | 1999 |
| Entree Chicago Recommendation Data | Transactional, Sequential | Recommender-Systems | Categorical | 50672 | NA | 2000 |
| CMU Face Images | Image | Classification | Integer | 640 | NA | 1999 |
| Insurance Company Benchmark (COIL 2000) | Multivariate | Regression, Description | Categorical, Integer | 9000 | 86 | 2000 |
| Internet Usage Data | Multivariate | NA | Categorical, Integer | 10104 | 72 | 1999 |
| IPUMS Census Database | Multivariate | NA | Categorical, Integer | 256932 | 61 | 1999 |
| Japanese Vowels | Multivariate, Time-Series | Classification | Real | 640 | 12 | NA |
| KDD Cup 1998 Data | Multivariate | Regression | Categorical, Integer | 191779 | 481 | 1998 |
| KDD Cup 1999 Data | Multivariate | Classification | Categorical, Integer | 4000000 | 42 | 1999 |
| M. Tuberculosis Genes | Relational | NA | NA | NA | NA | 2001 |
| Movie | Multivariate, Relational | NA | NA | 10000 | NA | 1999 |
| MSNBC.com Anonymous Web Data | Sequential | NA | Categorical | 989818 | NA | NA |
| NSF Research Award Abstracts 1990-2003 | Text | NA | NA | 129000 | NA | 2003 |
| Pioneer-1 Mobile Robot Data | Multivariate, Time-Series | NA | Categorical, Real | NA | NA | 1999 |
| Pseudo Periodic Synthetic Time Series | Univariate, Time-Series | NA | NA | 100000 | NA | 1999 |
| Reuters-21578 Text Categorization Collection | Text | Classification | Categorical | 21578 | 5 | 1997 |
| Robot Execution Failures | Multivariate, Time-Series | Classification | Integer | 463 | 90 | 1999 |
| Synthetic Control Chart Time Series | Time-Series | Classification, Clustering | Real | 600 | NA | 1999 |
| Syskill and Webert Web Page Ratings | Multivariate, Text | Classification | Categorical | 332 | 5 | 1998 |
| UNIX User Data | Text, Sequential | NA | NA | NA | NA | NA |
| Volcanoes on Venus - JARtool experiment | Image | Classification | NA | NA | NA | NA |
| Statlog (Australian Credit Approval) | Multivariate | Classification | Categorical, Integer, Real | 690 | 14 | NA |
| Statlog (German Credit Data) | Multivariate | Classification | Categorical, Integer | 1000 | 20 | 1994 |
| Statlog (Heart) | Multivariate | Classification | Categorical, Real | 270 | 13 | NA |
| Statlog (Landsat Satellite) | Multivariate | Classification | Integer | 6435 | 36 | 1993 |
| Statlog (Image Segmentation) | Multivariate | Classification | Real | 2310 | 19 | 1990 |
| Statlog (Shuttle) | Multivariate | Classification | Integer | 58000 | 9 | NA |
| Statlog (Vehicle Silhouettes) | Multivariate | Classification | Integer | 946 | 18 | NA |
| Connectionist Bench (Nettalk Corpus) | Multivariate | NA | Categorical | 20008 | 4 | NA |
| Connectionist Bench (Sonar, Mines vs. Rocks) | Multivariate | Classification | Real | 208 | 60 | NA |
| Connectionist Bench (Vowel Recognition - Deterding Data) | NA | Classification | Real | 528 | 10 | NA |
| Economic Sanctions | Domain-Theory | NA | NA | NA | NA | NA |
| Protein Data | NA | NA | NA | NA | NA | NA |
| Cloud | Multivariate | NA | Real | 1024 | 10 | 1989 |
| CalIt2 Building People Counts | Multivariate, Time-Series | NA | Categorical, Integer | 10080 | 4 | 2006 |
| Dodgers Loop Sensor | Multivariate, Time-Series | NA | Categorical, Integer | 50400 | 3 | 2006 |
| Poker Hand | Multivariate | Classification | Categorical, Integer | 1025010 | 11 | 2007 |
| MAGIC Gamma Telescope | Multivariate | Classification | Real | 19020 | 11 | 2007 |
| UJI Pen Characters | Multivariate, Sequential | Classification | Integer | 1364 | NA | 2007 |
| Mammographic Mass | Multivariate | Classification | Integer | 961 | 6 | 2007 |
| Forest Fires | Multivariate | Regression | Real | 517 | 13 | 2008 |
| Reuters Transcribed Subset | Text | Classification | NA | 200 | NA | 2008 |
| Bag of Words | Text | Clustering | Integer | 8000000 | 100000 | 2008 |
| Concrete Compressive Strength | Multivariate | Regression | Real | 1030 | 9 | 2007 |
| Hill-Valley | Sequential | Classification | Real | 606 | 101 | 2008 |
| Arcene | Multivariate | Classification | Real | 900 | 10000 | 2008 |
| Dexter | Multivariate | Classification | Integer | 2600 | 20000 | 2008 |
| Dorothea | Multivariate | Classification | Integer | 1950 | 100000 | 2008 |
| Gisette | Multivariate | Classification | Integer | 13500 | 5000 | 2008 |
| Madelon | Multivariate | Classification | Real | 4400 | 500 | 2008 |
| Ozone Level Detection | Multivariate, Sequential, Time-Series | Classification | Real | 2536 | 73 | 2008 |
| Abscisic Acid Signaling Network | Multivariate | Causal-Discovery | Integer | 300 | 43 | 2008 |
| Parkinsons | Multivariate | Classification | Real | 197 | 23 | 2008 |
| Character Trajectories | Time-Series | Classification, Clustering | Real | 2858 | 3 | 2008 |
| Blood Transfusion Service Center | Multivariate | Classification | Real | 748 | 5 | 2008 |
| UJI Pen Characters (Version 2) | Multivariate, Sequential | Classification | Integer | 11640 | NA | 2009 |
| Semeion Handwritten Digit | Multivariate | Classification | Integer | 1593 | 256 | 2008 |
| SECOM | Multivariate | Classification, Causal-Discovery | Real | 1567 | 591 | 2008 |
| Plants | Multivariate | Clustering | Categorical | 22632 | 70 | 2008 |
| Libras Movement | Multivariate, Sequential | Classification, Clustering | Real | 360 | 91 | 2009 |
| Concrete Slump Test | Multivariate | Regression | Real | 103 | 10 | 2009 |
| Communities and Crime | Multivariate | Regression | Real | 1994 | 128 | 2009 |
| Acute Inflammations | Multivariate | Classification | Categorical, Integer | 120 | 6 | 2009 |
| Wine Quality | Multivariate | Classification, Regression | Real | 4898 | 12 | 2009 |
| URL Reputation | Multivariate, Time-Series | Classification | Integer, Real | 2396130 | 3231961 | 2009 |
| p53 Mutants | Multivariate | Classification | Real | 16772 | 5409 | 2010 |
| Parkinsons Telemonitoring | Multivariate | Regression | Integer, Real | 5875 | 26 | 2009 |
| Demospongiae | Multivariate | Classification | Integer | 503 | NA | 2010 |
| Opinosis Opinion / Review | Text | NA | NA | 51 | NA | 2010 |
| Breast Tissue | Multivariate | Classification | Real | 106 | 10 | 2010 |
| Cardiotocography | Multivariate | Classification | Real | 2126 | 23 | 2010 |
| Wall-Following Robot Navigation Data | Multivariate, Sequential | Classification | Real | 5456 | 24 | 2010 |
| Spoken Arabic Digit | Multivariate, Time-Series | Classification | Real | 8800 | 13 | 2010 |
| Localization Data for Person Activity | Univariate, Sequential, Time-Series | Classification | Real | 164860 | 8 | 2010 |
| AutoUniv | Multivariate | Classification | Categorical, Integer, Real | NA | NA | 2010 |
| Steel Plates Faults | Multivariate | Classification | Integer, Real | 1941 | 27 | 2010 |
| MiniBooNE particle identification | Multivariate | Classification | Real | 130065 | 50 | 2010 |
| YearPredictionMSD | Multivariate | Regression | Real | 515345 | 90 | 2011 |
| PEMS-SF | Multivariate, Time-Series | Classification | Real | 440 | 138672 | 2011 |
| OpinRank Review Dataset | Text | NA | NA | NA | NA | 2011 |
| Relative location of CT slices on axial axis | Domain-Theory | Regression | Real | 53500 | 386 | 2011 |
| Online Handwritten Assamese Characters Dataset | Multivariate, Sequential | Classification | Integer | 8235 | NA | 2011 |
| PubChem Bioassay Data | Multivariate | Classification | Integer, Real | NA | NA | 2011 |
| Record Linkage Comparison Patterns | Multivariate | Classification | Real | 5749132 | 12 | 2011 |
| Communities and Crime Unnormalized | Multivariate | Regression | Real | 2215 | 147 | 2011 |
| Vertebral Column | Multivariate | Classification | Real | 310 | 6 | 2011 |
| EMG Physical Action Data Set | Time-Series | Classification | Real | 10000 | 8 | 2011 |
| Vicon Physical Action Data Set | Time-Series | Classification | Real | 3000 | 27 | 2011 |
| Amazon Commerce reviews set | Multivariate, Text, Domain-Theory | Classification | Real | 1500 | 10000 | 2011 |
| Amazon Access Samples | Time-Series, Domain-Theory | Regression, Clustering, Causal-Discovery | NA | 30000 | 20000 | 2011 |
| Reuter_50_50 | Multivariate, Text, Domain-Theory | Classification, Clustering | Real | 2500 | 10000 | 2011 |
| Farm Ads | Text | Classification | NA | 4143 | 54877 | 2011 |
| DBWorld e-mails | Text | Classification | NA | 64 | 4702 | 2011 |
| KEGG Metabolic Relation Network (Directed) | Multivariate, Univariate, Text | Classification, Regression, Clustering | Integer, Real | 53414 | 24 | 2011 |
| KEGG Metabolic Reaction Network (Undirected) | Multivariate, Univariate, Text | Classification, Regression, Clustering | Integer, Real | 65554 | 29 | 2011 |
| Bank Marketing | Multivariate | Classification | Real | 45211 | 17 | 2012 |
| YouTube Comedy Slam Preference Data | Text | Classification | NA | 1138562 | 3 | 2012 |
| Gas Sensor Array Drift Dataset | Multivariate | Classification | Real | 13910 | 128 | 2012 |
| ILPD (Indian Liver Patient Dataset) | Multivariate | Classification | Integer, Real | 583 | 10 | 2012 |
| OPPORTUNITY Activity Recognition | Multivariate, Time-Series | Classification | Real | 2551 | 242 | 2012 |
| Nomao | Univariate | Classification | Real | 34465 | 120 | 2012 |
| SMS Spam Collection | Multivariate, Text, Domain-Theory | Classification, Clustering | Real | 5574 | NA | 2012 |
| Skin Segmentation | Univariate | Classification | Real | 245057 | 4 | 2012 |
| Planning Relax | Univariate | Classification | Real | 182 | 13 | 2012 |
| PAMAP2 Physical Activity Monitoring | Multivariate, Time-Series | Classification | Real | 3850505 | 52 | 2012 |
| Restaurant & consumer data | Multivariate | NA | NA | 138 | 47 | 2012 |
| CNAE-9 | Multivariate, Text | Classification | Integer | 1080 | 857 | 2012 |
| Individual household electric power consumption | Multivariate, Time-Series | Regression, Clustering | Real | 2075259 | 9 | 2012 |
| seeds | Multivariate | Classification, Clustering | Real | 210 | 7 | 2012 |
| Northix | Multivariate, Univariate, Text | Classification | Integer, Real | 115 | 200 | 2012 |
| QtyT40I10D100K | Sequential | NA | Integer | 3960456 | 4 | 2012 |
| Legal Case Reports | Text | Classification | NA | NA | NA | 2012 |
| Human Activity Recognition Using Smartphones | Multivariate, Time-Series | Classification, Clustering | NA | 10299 | 561 | 2012 |
| One-hundred plant species leaves data set | NA | Classification | Real | 1600 | 64 | 2012 |
| Energy efficiency | Multivariate | Classification, Regression | Integer, Real | 768 | 8 | 2012 |
| Yacht Hydrodynamics | Multivariate | Regression | Real | 308 | 7 | 2013 |
| Fertility | Multivariate | Classification, Regression | Real | 100 | 10 | 2013 |
| Daphnet Freezing of Gait | Multivariate, Time-Series | Classification | Real | 237 | 9 | 2013 |
| 3D Road Network (North Jutland, Denmark) | Sequential, Text | Regression, Clustering | Real | 434874 | 4 | 2013 |
| ISTANBUL STOCK EXCHANGE | Multivariate, Univariate, Time-Series | Classification, Regression | Real | 536 | 8 | 2013 |
| Buzz in social media | Time-Series, Multivariate | Regression, Classification | Integer, Real | 140000 | 77 | 2013 |
| First-order theorem proving | Multivariate | Classification | Real | 6118 | 51 | 2013 |
| Wearable Computing: Classification of Body Postures and Movements (PUC-Rio) | Sequential | Classification | Integer, Real | 165632 | 18 | 2013 |
| Gas sensor arrays in open sampling settings | Multivariate, Time-Series | Classification | Real | 18000 | 1950000 | 2013 |
| Climate Model Simulation Crashes | Multivariate | Classification | Real | 540 | 18 | 2013 |
| MicroMass | Multivariate | Classification | Real | 931 | 1300 | 2013 |
| QSAR biodegradation | Multivariate | Classification | Integer, Real | 1055 | 41 | 2013 |
| BLOGGER | Multivariate | Classification | NA | 100 | 6 | 2013 |
| Daily and Sports Activities | Multivariate, Time-Series | Classification, Clustering | Real | 9120 | 5625 | 2013 |
| User Knowledge Modeling | Multivariate | Classification, Clustering | Integer | 403 | 5 | 2013 |
| Reuters RCV1 RCV2 Multilingual, Multiview Text Categorization Test collection | Multivariate | Classification | Real | 111740 | NA | 2013 |
| NYSK | Multivariate, Sequential, Text | Clustering | NA | 10421 | 7 | 2013 |
| Turkiye Student Evaluation | Multivariate | Classification, Clustering | NA | 5820 | 33 | 2013 |
| ser Knowledge Modeling Data (Students’ Knowledge Levels on DC Electrical Machines) | Multivariate | Classification | Real | 403 | 5 | 2013 |
| EEG Eye State | Multivariate, Sequential, Time-Series | Classification | Integer, Real | 14980 | 15 | 2013 |
| Physicochemical Properties of Protein Tertiary Structure | Multivariate | Regression | Real | 45730 | 9 | 2013 |
| seismic-bumps | Multivariate | Classification | Real | 2584 | 19 | 2013 |
| banknote authentication | Multivariate | Classification | Real | 1372 | 5 | 2013 |
| USPTO Algorithm Challenge, run by NASA-Harvard Tournament Lab and TopCoder Problem: Pat | Domain-Theory | Classification | Integer | 306 | 5 | 2013 |
| YouTube Multiview Video Games Dataset | Multivariate, Text | Classification, Clustering | Integer, Real | 120000 | 1000000 | 2013 |
| Gas Sensor Array Drift Dataset at Different Concentrations | Multivariate, Time-Series | Classification, Regression, Clustering, Causa | Real | 13910 | 129 | 2013 |
| Activities of Daily Living (ADLs) Recognition Using Binary Sensors | Multivariate, Sequential, Time-Series | Classification, Clustering | NA | 2747 | NA | 2013 |
| SkillCraft1 Master Table Dataset | Multivariate | Regression | Integer, Real | 3395 | 20 | 2013 |
| Weight Lifting Exercises monitored with Inertial Measurement Units | Multivariate | Classification | Real | 39242 | 152 | 2013 |
| SML2010 | Multivariate, Sequential, Time-Series, Text | Regression | Real | 4137 | 24 | 2014 |
| Bike Sharing Dataset | Univariate | Regression | Integer, Real | 17389 | 16 | 2013 |
| Predict keywords activities in a online social media | Multivariate, Sequential, Time-Series | NA | Integer, Real | 51 | 35 | 2013 |
| Thoracic Surgery Data | Multivariate | Classification | Integer, Real | 470 | 17 | 2013 |
| EMG dataset in Lower Limb | Multivariate, Time-Series | NA | Real | 132 | 5 | 2014 |
| SUSY | NA | Classification | Real | 5000000 | 18 | 2014 |
| HIGGS | NA | Classification | Real | 11000000 | 28 | 2014 |
| Qualitative_Bankruptcy | Multivariate | Classification | NA | 250 | 7 | 2014 |
| LSVT Voice Rehabilitation | Multivariate | Classification | Real | 126 | 309 | 2014 |
| Dataset for ADL Recognition with Wrist-worn Accelerometer | Multivariate, Time-Series | Classification, Clustering | NA | NA | 3 | 2014 |
| Wilt | Multivariate | Classification | NA | 4889 | 6 | 2014 |
| User Identification From Walking Activity | Univariate, Sequential, Time-Series | Classification, Clustering | Real | NA | NA | 2014 |
| Activity Recognition from Single Chest-Mounted Accelerometer | Univariate, Sequential, Time-Series | Classification, Clustering | Real | NA | NA | 2014 |
| Leaf | Multivariate | Classification | Real | 340 | 16 | 2014 |
| Dresses_Attribute_Sales | Text | Classification, Clustering | NA | 501 | 13 | 2014 |
| Tamilnadu Electricity Board Hourly Readings | Multivariate | Classification, Regression, Clustering | Real | 45781 | 5 | 2013 |
| Airfoil Self-Noise | Multivariate | Regression | Real | 1503 | 6 | 2014 |
| Wholesale customers | Multivariate | Classification, Clustering | Integer | 440 | 8 | 2014 |
| Twitter Data set for Arabic Sentiment Analysis | Text | Classification | NA | 2000 | 2 | 2014 |
| Combined Cycle Power Plant | Multivariate | Regression | Real | 9568 | 4 | 2014 |
| Urban Land Cover | Multivariate | Classification | NA | 168 | 148 | 2014 |
| Diabetes 130-US hospitals for years 1999-2008 | Multivariate | Classification, Clustering | Integer | 100000 | 55 | 2014 |
| Bach Choral Harmony | Sequential | Classification | NA | 5665 | 17 | 2014 |
| StoneFlakes | Multivariate | Classification, Clustering, Causal-Discovery | Real | 79 | 8 | 2014 |
| Tennis Major Tournament Match Statistics | Multivariate | Classification, Regression, Clustering | Integer, Real | 127 | 42 | 2014 |
| Parkinson Speech Dataset with Multiple Types of Sound Recordings | Multivariate | Classification, Regression | Integer, Real | 1040 | 26 | 2014 |
| Gesture Phase Segmentation | Multivariate, Sequential, Time-Series | Classification, Clustering | Real | 9900 | 50 | 2014 |
| Perfume Data | Univariate, Domain-Theory | Classification, Clustering | Integer | 560 | 2 | 2014 |
| BlogFeedback | Multivariate | Regression | Integer, Real | 60021 | 281 | 2014 |
| REALDISP Activity Recognition Dataset | Multivariate, Time-Series | Classification | Real | 1419 | 120 | 2014 |
| Newspaper and magazine images segmentation dataset | NA | Classification | NA | 101 | NA | 2014 |
| AAAI 2014 Accepted Papers | Multivariate | Clustering | NA | 399 | 6 | 2014 |
| Gas sensor array under flow modulation | Multivariate, Time-Series | Classification, Regression | Real | 58 | 120432 | 2014 |
| Gas sensor array exposed to turbulent gas mixtures | Multivariate, Time-Series | Classification, Regression | Real | 180 | 150000 | 2014 |
| UJIIndoorLoc | Multivariate | Classification, Regression | Integer, Real | 21048 | 529 | 2014 |
| Sentence Classification | Text | Classification | Integer | NA | NA | 2014 |
| Dow Jones Index | Time-Series | Classification, Clustering | Integer, Real | 750 | 16 | 2014 |
| sEMG for Basic Hand movements | Time-Series | Classification | Real | 3000 | 2500 | 2014 |
| AAAI 2013 Accepted Papers | Multivariate | Clustering | NA | 150 | 5 | 2014 |
| Geographical Original of Music | Multivariate | Classification, Regression | Real | 1059 | 68 | 2014 |
| Condition Based Maintenance of Naval Propulsion Plants | Multivariate | Regression | Real | 11934 | 16 | 2014 |
| Grammatical Facial Expressions | Multivariate, Sequential | Classification, Clustering | Real | 27965 | 100 | 2014 |
| NoisyOffice | Multivariate | Classification, Regression | Real | 216 | 216 | 2015 |
| MHEALTH Dataset | Multivariate, Time-Series | Classification | Real | 120 | 23 | 2014 |
| Student Performance | Multivariate | Classification, Regression | Integer | 649 | 33 | 2014 |
| ElectricityLoadDiagrams20112014 | Time-Series | Regression, Clustering | Real | 370 | 140256 | 2015 |
| Gas sensor array under dynamic gas mixtures | Multivariate, Time-Series | Classification, Regression | Real | 4178504 | 19 | 2015 |
| microblogPCU | Multivariate, Univariate, Sequential, Text | Classification, Causal-Discovery | Integer, Real | 221579 | 20 | 2015 |
| Firm-Teacher_Clave-Direction_Classification | Multivariate | Classification | NA | 10800 | 20 | 2015 |
| Dataset for Sensorless Drive Diagnosis | Multivariate | Classification | Real | 58509 | 49 | 2015 |
| TV News Channel Commercial Detection Dataset | Multivariate | Classification, Clustering | Real | 129685 | 12 | 2015 |
| Phishing Websites | NA | Classification | Integer | 2456 | 30 | 2015 |
| Greenhouse Gas Observing Network | Multivariate, Time-Series | Regression | Real | 2921 | 5232 | 2015 |
| Diabetic Retinopathy Debrecen Data Set | Multivariate | Classification | Integer, Real | 1151 | 20 | 2014 |
| HIV-1 protease cleavage | Multivariate | Classification | Categorical | 6590 | 1 | 2015 |
| Sentiment Labelled Sentences | Text | Classification | NA | 3000 | NA | 2015 |
| Online News Popularity | Multivariate | Classification, Regression | Integer, Real | 39797 | 61 | 2015 |
| Forest type mapping | Multivariate | Classification | NA | 326 | 27 | 2015 |
| wiki4HE | Multivariate | Regression, Clustering, Causal-Discovery | NA | 913 | 53 | 2015 |
| Online Video Characteristics and Transcoding Time Dataset | Multivariate | Regression | Integer, Real | 168286 | 11 | 2015 |
| Chronic_Kidney_Disease | Multivariate | Classification | Real | 400 | 25 | 2015 |
| Machine Learning based ZZAlpha Ltd. Stock Recommendations 2012-2014 | Sequential, Time-Series | Classification | Real | 314080 | 0 | 2015 |
| Folio | Multivariate | Classification, Clustering | NA | 637 | 20 | 2015 |
| Taxi Service Trajectory - Prediction Challenge, ECML PKDD 2015 | Multivariate, Sequential, Time-Series, Domain-Theory | Clustering, Causal-Discovery | Real | 1710671 | 9 | 2015 |
| Cuff-Less Blood Pressure Estimation | Multivariate | Classification, Regression | Real | 12000 | 3 | 2015 |
| Smartphone-Based Recognition of Human Activities and Postural Transitions | Multivariate, Time-Series | Classification | Real | 10929 | 561 | 2015 |
| Mice Protein Expression | Multivariate | Classification, Clustering | Real | 1080 | 82 | 2015 |
| UJIIndoorLoc-Mag | Multivariate, Sequential, Time-Series | Classification, Regression, Clustering | Integer, Real | 40000 | 13 | 2015 |
| Heterogeneity Activity Recognition | Multivariate, Time-Series | Classification, Clustering | Real | 43930257 | 16 | 2015 |
| Educational Process Mining (EPM): A Learning Analytics Data Set | Multivariate, Sequential, Time-Series | Classification, Regression, Clustering | Integer | 230318 | 13 | 2015 |
| HEPMASS | Multivariate | Classification | Real | 10500000 | 28 | 2016 |
| Indoor User Movement Prediction from RSS data | Multivariate, Sequential, Time-Series | Classification | Real | 13197 | 4 | 2016 |
| Open University Learning Analytics dataset | Multivariate, Sequential, Time-Series | Classification, Regression, Clustering | Integer | NA | NA | 2015 |
| default of credit card clients | Multivariate | Classification | Integer, Real | 30000 | 24 | 2016 |
| Mesotheliomaâ<U+0080><U+0099>s disease data set | Multivariate | Classification | Real | 324 | 34 | 2016 |
| Online Retail | Multivariate, Sequential, Time-Series | Classification, Clustering | Integer, Real | 541909 | 8 | 2015 |
| SIFT10M | Multivariate | Causal-Discovery | Integer | 11164866 | 128 | 2016 |
| GPS Trajectories | Multivariate | Classification, Regression | Real | 163 | 15 | 2016 |
| Detect Malacious Executable(AntiVirus) | Multivariate | Classification | Real | 373 | 513 | 2016 |
| Occupancy Detection | Multivariate, Time-Series | Classification | Real | 20560 | 7 | 2016 |
| Improved Spiral Test Using Digitized Graphics Tablet for Monitoring Parkinsonâ<U+0080><U+0099>s Disease | Multivariate | Classification, Regression, Clustering | Real | 40 | 7 | 2016 |
| News Aggregator | Multivariate | Classification, Clustering | NA | 422937 | 5 | 2016 |
| Air Quality | Multivariate, Time-Series | Regression | Real | 9358 | 15 | 2016 |
| Twin gas sensor arrays | Multivariate, Time-Series, Domain-Theory | Classification, Regression | Real | 640 | 480000 | 2016 |
| Gas sensors for home activity monitoring | Multivariate, Time-Series | Classification | Real | 919438 | 11 | 2016 |
| Facebook Comment Volume Dataset | Multivariate | Regression | Integer, Real | 40949 | 54 | 2016 |
| Smartphone Dataset for Human Activity Recognition (HAR) in Ambient Assisted Living (AAL) | Time-Series | Classification | Real | 5744 | 561 | 2016 |
| Polish companies bankruptcy data | Multivariate | Classification | Real | 10503 | 64 | 2016 |
| Activity Recognition system based on Multisensor data fusion (AReM) | Multivariate, Sequential, Time-Series | Classification | Real | 42240 | 6 | 2016 |
| Dota2 Games Results | Multivariate | Classification | NA | 102944 | 116 | 2016 |
| Facebook metrics | Multivariate | Regression | Integer | 500 | 19 | 2016 |
| UbiqLog (smartphone lifelogging) | Multivariate | Causal-Discovery | NA | 9782222 | NA | 2016 |
| NIPS Conference Papers 1987-2015 | Text | Clustering | Integer | 11463 | 5812 | 2016 |
| HTRU2 | Multivariate | Classification, Clustering | Real | 17898 | 9 | 2017 |
| Drug consumption (quantified) | Multivariate | Classification | Real | 1885 | 32 | 2016 |
| Appliances energy prediction | Multivariate, Time-Series | Regression | Real | 19735 | 29 | 2017 |
| Miskolc IIS Hybrid IPS | Text | Classification, Clustering, Causal-Discovery | Integer | 1540 | 67 | 2016 |
| KDC-4007 dataset Collection | Multivariate, Text | Classification, Regression | Integer | 4007 | NA | 2017 |
| Geo-Magnetic field and WLAN dataset for indoor localisation from wristband and smartphone | Multivariate, Sequential, Time-Series | Classification, Regression, Clustering | Integer, Real | 153540 | 25 | 2017 |
| DrivFace | Multivariate | Classification, Regression, Clustering | Real | 606 | 6400 | 2016 |
| Website Phishing | Multivariate | Classification | Integer | 1353 | 10 | 2016 |
| YouTube Spam Collection | Text | Classification | NA | 1956 | 5 | 2017 |
| Beijing PM2.5 Data | Multivariate, Time-Series | Regression | Integer, Real | 43824 | 13 | 2017 |
| Cargo 2000 Freight Tracking and Tracing | Multivariate, Sequential | Classification, Regression | Integer | 3942 | 98 | 2016 |
| Cervical cancer (Risk Factors) | Multivariate | Classification | Integer, Real | 858 | 36 | 2017 |
| Quality Assessment of Digital Colposcopies | Multivariate | Classification | Real | 287 | 69 | 2017 |
| KASANDR | Multivariate | Causal-Discovery | Integer | 17764280 | 2158859 | 2017 |
| FMA: A Dataset For Music Analysis | Multivariate, Time-Series | Classification, Clustering | Real | 106574 | 518 | 2017 |
| Air quality | Multivariate, Time-Series | Regression | Real | 9358 | 15 | 2016 |
| Epileptic Seizure Recognition | Multivariate, Time-Series | Classification, Clustering | Integer, Real | 11500 | 179 | 2017 |
| Devanagari Handwritten Character Dataset | NA | Classification | Integer | 92000 | NA | 2016 |
| Stock portfolio performance | Multivariate | Regression | Real | 315 | 12 | 2016 |
| MoCap Hand Postures | Multivariate | Classification, Clustering | Integer, Real | 78095 | 38 | 2016 |
| Early biomarkers of Parkinson<U+0092>s disease based on natural connected speech | Multivariate | Classification, Regression | Integer, Real | 130 | 65 | 2017 |
| Data for Software Engineering Teamwork Assessment in Education Setting | Sequential, Time-Series | Classification | Integer, Real | 74 | 102 | 2017 |
| PM2.5 Data of Five Chinese Cities | Multivariate, Time-Series | Regression | Integer, Real | 52854 | 86 | 2017 |
| Parkinson Disease Spiral Drawings Using Digitized Graphics Tablet | Multivariate | Classification, Regression, Clustering | Integer | 77 | 7 | 2017 |
| Sales_Transactions_Dataset_Weekly | Multivariate, Time-Series | Clustering | Integer, Real | 811 | 53 | 2017 |
| Las Vegas Strip | NA | Classification, Regression | Integer | 504 | 20 | 2017 |
| Eco-hotel | Text | NA | NA | 401 | 1 | 2017 |
| MEU-Mobile KSD | Multivariate | Classification | Integer, Real | 2856 | 71 | 2016 |
| Crowdsourced Mapping | Multivariate | Classification | NA | 10546 | 29 | 2016 |
| gene expression cancer RNA-Seq | Multivariate | Classification, Clustering | Real | 801 | 20531 | 2016 |
| Hybrid Indoor Positioning Dataset from WiFi RSSI, Bluetooth and magnetometer | Multivariate, Sequential, Time-Series | Classification | Real | 1540 | 65 | 2016 |
| chestnut â<U+0080><U+0093> LARVIC | NA | Classification, Clustering | NA | 1451 | 3 | 2017 |
| Burst Header Packet (BHP) flooding attack on Optical Burst Switching (OBS) Network | Text | Classification | Integer | 1075 | 22 | 2017 |
| Motion Capture Hand Postures | Multivariate | Classification, Clustering | Real | 78095 | 38 | 2017 |
| Anuran Calls (MFCCs) | Multivariate | Classification, Clustering | Real | 7195 | 22 | 2017 |
| TTC-3600: Benchmark dataset for Turkish text categorization | Text | Classification, Clustering | Integer | 3600 | 4814 | 2017 |
| Gastrointestinal Lesions in Regular Colonoscopy | Multivariate | Classification | Real | 76 | 698 | 2016 |
| Daily Demand Forecasting Orders | Time-Series | Regression | Integer | 60 | 13 | 2017 |
| Paper Reviews | Text | Classification, Regression | Integer | 405 | 10 | 2017 |
| extention of Z-Alizadeh sani dataset | NA | Classification | Integer, Real | 303 | 59 | 2017 |
| Z-Alizadeh Sani | NA | Classification | Integer, Real | 303 | 56 | 2017 |
| Dynamic Features of VirusShare Executables | Multivariate, Time-Series | Classification, Regression | Integer | 107888 | 482 | 2017 |
| IDA2016Challenge | Multivariate | Classification | Integer | 76000 | 171 | 2017 |
| DSRC Vehicle Communications | Sequential, Text | Clustering | Real | 10000 | 5 | 2017 |
| Mturk User-Perceived Clusters over Images | Multivariate, Text | Clustering | Integer | 180 | 500 | 2016 |
| Character Font Images | Multivariate | Classification | Integer, Real | 745000 | 411 | 2016 |
| DeliciousMIL: A Data Set for Multi-Label Multi-Instance Learning with Instance Labels | Text | Classification | Integer | 12234 | 8519 | 2016 |
| Autistic Spectrum Disorder Screening Data for Children | Multivariate | Classification | Integer | 292 | 21 | 2017 |
| Autistic Spectrum Disorder Screening Data for Adolescent | Multivariate | Classification | Integer | 104 | 21 | 2017 |
| APS Failure at Scania Trucks | Multivariate | Classification | Integer, Real | 60000 | 171 | 2017 |
| Wireless Indoor Localization | Multivariate | Classification | Real | 2000 | 7 | 2017 |
| HCC Survival | Multivariate | Classification | Integer, Real | 165 | 49 | 2017 |
| CSM (Conventional and Social Media Movies) Dataset 2014 and 2015 | Multivariate | Classification, Regression | Integer | 217 | 12 | 2017 |
| University of Tehran Question Dataset 2016 (UTQD.2016) | Text | Classification | NA | 1175 | 3 | 2017 |
| Autism Screening Adult | NA | Classification | Integer | 704 | 21 | 2017 |
| Activity recognition with healthy older people using a batteryless wearable sensor | Sequential | Classification | Real | 75128 | 9 | 2016 |
| Immunotherapy Dataset | Univariate | Classification | Integer, Real | 90 | 8 | 2018 |
| Cryotherapy Dataset | Univariate | Classification | Integer, Real | 90 | 7 | 2018 |
| OCT data & Color Fundus Images of Left & Right Eyes | Multivariate | Classification | Real | 50 | 2 | 2016 |
| Discrete Tone Image Dataset | Multivariate | Classification | NA | 71 | 11 | 2018 |
| News Popularity in Multiple Social Media Platforms | Multivariate, Time-Series, Text | Regression | Integer, Real | 93239 | 11 | 2018 |
| Ultrasonic flowmeter diagnostics | Multivariate | Classification | Real | 540 | 173 | 2018 |
| ICMLA 2014 Accepted Papers Data Set | Multivariate | Classification, Clustering | NA | 105 | 5 | 2018 |
| BLE RSSI Dataset for Indoor localization and Navigation | Multivariate, Sequential, Time-Series | Classification, Clustering | Integer | 6611 | 15 | 2018 |
| Container Crane Controller Data Set | Univariate, Domain-Theory | Classification, Regression | Real | 15 | 3 | 2018 |
| Residential Building Data Set | Multivariate | Regression | Real | 372 | 105 | 2018 |
| Health News in Twitter | Text | Clustering | Real | 58000 | 25000 | 2018 |
| chipseq | Sequential | Classification | Integer | 4960 | NA | 2018 |
| SGEMM GPU kernel performance | Multivariate | Regression | Integer | 241600 | 18 | 2018 |
| Repeat Consumption Matrices | Multivariate | Clustering | Real | 130000 | 21000 | 2018 |
| detection_of_IoT_botnet_attacks_N_BaIoT | Multivariate, Sequential | Classification, Clustering | Real | 7062606 | 115 | 2018 |
| Absenteeism at work | Multivariate, Time-Series | Classification, Clustering | Integer, Real | 740 | 21 | 2018 |
| SCADI | Multivariate | Classification, Clustering | NA | 70 | 206 | 2018 |
| Condition monitoring of hydraulic systems | Multivariate, Time-Series | Classification, Regression | Real | 2205 | 43680 | 2018 |
| Carbon Nanotubes | Univariate | Regression | Real | 10721 | 8 | 2018 |
| Optical Interconnection Network | Multivariate | Classification, Regression | Integer, Real | 640 | 10 | 2018 |
| Sports articles for objectivity analysis | Multivariate, Text | Classification | Integer | 1000 | 59 | 2018 |
| Breast Cancer Coimbra | Multivariate | Classification | Integer | 116 | 10 | 2018 |
| GNFUV Unmanned Surface Vehicles Sensor Data | Multivariate, Time-Series | Regression | Real | 1672 | 5 | 2018 |
| Dishonest Internet users Dataset | Multivariate | Classification, Clustering | NA | 322 | 5 | 2018 |
| Victorian Era Authorship Attribution | Text | Classification | NA | 93600 | 1000 | 2018 |
| Simulated Falls and Daily Living Activities Data Set | Time-Series | Classification | Integer | 3060 | 138 | 2018 |
| Multimodal Damage Identification for Humanitarian Computing | Multivariate, Text | Classification | Integer | 5879 | NA | 2018 |
| EEG Steady-State Visual Evoked Potential Signals | Multivariate, Time-Series | Classification, Regression | Integer | 9200 | 16 | 2018 |
| Roman Urdu Data Set | Text | Classification | NA | 20000 | 2 | 2018 |
| Avila | Multivariate | Classification | Real | 20867 | 10 | 2018 |
| PANDOR | Multivariate | Recommendation | Categorical | NA | NA | 2018 |
| Drug Review Dataset (Druglib.com) | Multivariate, Text | Classification, Regression, Clustering | Integer | 4143 | 8 | 2018 |
| Drug Review Dataset (Drugs.com) | Multivariate, Text | Classification, Regression, Clustering | Integer | 215063 | 6 | 2018 |
| Physical Unclonable Functions | Multivariate | Classification | Integer | 6000000 | 129 | 2018 |
| Superconductivty Data | Multivariate | Regression | Real | 21263 | 81 | 2018 |
| WESAD (Wearable Stress and Affect Detection) | Multivariate, Time-Series | Classification, Regression | Real | 63000000 | 12 | 2018 |
| GNFUV Unmanned Surface Vehicles Sensor Data Set 2 | Multivariate, Sequential, Time-Series | Regression | Real | 10190 | 6 | 2018 |
| Student Academics Performance | Multivariate | Classification | NA | 300 | 22 | 2018 |
| Online Shoppers Purchasing Intention Dataset | Multivariate | Classification, Clustering | Integer, Real | 12330 | 18 | 2018 |
| PMU-UD | Univariate | Classification | NA | 5180 | 9 | 2018 |
| Parkinson’s Disease Classification | Multivariate | Classification | Integer, Real | 756 | 754 | 2018 |
| Electrical Grid Stability Simulated Data | Multivariate | Classification, Regression | Real | 10000 | 14 | 2018 |
| Caesarian Section Classification Dataset | Univariate | Classification | Integer | 80 | 5 | 2018 |
| BAUM-1 | Time-Series | Classification | NA | 1184 | NA | 2018 |
| BAUM-2 | Time-Series | Classification | NA | 1047 | NA | 2018 |
| Audit Data | Multivariate | Classification | Real | 777 | 18 | 2018 |
| BuddyMove Data Set | Multivariate, Text | Classification, Clustering | Real | 249 | 7 | 2018 |
| Real estate valuation data set | Multivariate | Regression | Integer, Real | 414 | 7 | 2018 |
| Early biomarkers of Parkinsonâ<U+0080><U+0099>s disease based on natural connected speech Data Set | Multivariate | Classification | Real | NA | NA | 2018 |
| Somerville Happiness Survey | NA | Classification | Integer | 143 | 7 | 2018 |
| 2.4 GHZ Indoor Channel Measurements | Multivariate | Classification | Real | 7840 | 5 | 2018 |
| EMG data for gestures | Time-Series | Classification | Real | 30000 | 6 | 2019 |
| Parking Birmingham | Multivariate, Univariate, Sequential, Time-Series | Classification, Regression, Clustering | Real | 35717 | 4 | 2019 |
| Behavior of the urban traffic of the city of Sao Paulo in Brazil | Multivariate, Time-Series | Classification, Regression | Integer, Real | 135 | 18 | 2018 |
| Travel Reviews | Multivariate, Text | Classification, Clustering | Real | 980 | 11 | 2018 |
| Tarvel Review Ratings | Multivariate, Text | Classification, Clustering | Real | 5456 | 25 | 2018 |
| Rice Leaf Diseases | Multivariate | Classification | Integer | 120 | NA | 2019 |
| Gas sensor array temperature modulation | Multivariate, Time-Series | Classification, Regression | Real | 4095000 | 20 | 2019 |
| Facebook Live Sellers in Thailand | Multivariate | Clustering | Integer | 7051 | 12 | 2019 |
| Parkinson Dataset with replicated acoustic features | Multivariate | Classification | NA | 240 | 46 | 2019 |
| Metro Interstate Traffic Volume | Multivariate, Sequential, Time-Series | Regression | Integer, Real | 48204 | 9 | 2019 |
| Query Analytics Workloads Dataset | Multivariate | Regression, Clustering | Real | 260000 | 8 | 2019 |
| Wave Energy Converters | Multivariate | Regression | Real | 288000 | 49 | 2019 |
| PPG-DaLiA | Multivariate, Time-Series | Regression | Real | 8300000 | 11 | 2019 |
| Alcohol QCM Sensor Dataset | Multivariate | Classification, Regression, Clustering | Real | 125 | 8 | 2019 |
| Divorce Predictors data set | Multivariate, Univariate | Classification | Integer | 170 | 54 | 2019 |
| Incident management process enriched event log | Multivariate, Sequential | Regression, Clustering | Integer | 141712 | 36 | 2019 |
| Opinion Corpus for Lebanese Arabic Reviews (OCLAR) | Text | Classification | Integer | 3916 | 3916 | 2019 |
| MEx | Time-Series | Classification, Clustering | Real | 6262 | 710 | 2019 |
| Beijing Multi-Site Air-Quality Data | Multivariate, Time-Series | Regression | Integer, Real | 420768 | 18 | 2019 |
| Online Retail II | Multivariate, Sequential, Time-Series, Text | Classification, Regression, Clustering | Integer, Real | 1067371 | 8 | 2019 |
| Hepatitis C Virus (HCV) for Egyptian patients | Multivariate | Classification | Integer, Real | 1385 | 29 | 2019 |
| QSAR fish toxicity | Multivariate | Regression | Real | 908 | 7 | 2019 |
| QSAR aquatic toxicity | Multivariate | Regression | Real | 546 | 9 | 2019 |
| Human Activity Recognition from Continuous Ambient Sensor Data | Multivariate, Sequential, Time-Series | Classification | Integer, Real | 13956534 | 37 | 2019 |
| WISDM Smartphone and Smartwatch Activity and Biometrics Dataset | Multivariate, Time-Series | Classification | Real | 15630426 | 6 | 2019 |
| QSAR oral toxicity | Multivariate | Classification | NA | 8992 | 1024 | 2019 |
| QSAR androgen receptor | Multivariate | Classification | NA | 1687 | 1024 | 2019 |
| QSAR Bioconcentration classes dataset | Multivariate | Classification, Regression | NA | 779 | 14 | 2019 |
| QSAR fish bioconcentration factor (BCF) | Multivariate | Regression | Integer, Real | 1056 | 7 | 2019 |
| A study of Asian Religious and Biblical Texts | Multivariate, Text | Classification, Clustering | Integer | 590 | 8265 | 2019 |
| Real-time Election Results: Portugal 2019 | Multivariate, Time-Series, Text | Regression | Integer, Real | 21643 | 29 | 2019 |
| Bias correction of numerical prediction model temperature forecast | Multivariate | Regression | Real | 7750 | 25 | 2020 |
| Bar Crawl: Detecting Heavy Drinking | Multivariate, Time-Series | Classification, Regression | Real | 14057567 | 3 | 2020 |
| Kitsune Network Attack Dataset | Multivariate, Sequential, Time-Series | Classification, Clustering, Causal-Discovery | Real | 27170754 | 115 | 2019 |
| Shoulder Implant X-Ray Manufacturer Classification | Multivariate | Classification | Real | 597 | 1 | 2020 |
| Speaker Accent Recognition | Multivariate | Classification | Real | 329 | 12 | 2020 |
| Heart failure clinical records | Multivariate | Classification, Regression, Clustering | Integer, Real | 299 | 13 | 2020 |
| Deepfakes: Medical Image Tamper Detection | Multivariate | Classification | Real | 20000 | 200000 | 2020 |
| selfBACK | Time-Series | Classification, Clustering | Real | 26136 | 6 | 2020 |
| South German Credit | Multivariate | Classification, Regression, Clustering | Integer, Real | 1000 | 21 | 2019 |
| Exasens | Multivariate | Classification, Clustering | Integer | 399 | 4 | 2020 |
| Swarm Behaviour | Multivariate | Classification | Real | 24017 | 2400 | 2020 |
| Crop mapping using fused optical-radar data set | Multivariate, Time-Series | Classification | Real | 325834 | 175 | 2020 |
| BitcoinHeistRansomwareAddressDataset | Multivariate, Time-Series | Classification, Clustering | Integer, Real | 2916697 | 10 | 2020 |
| Facebook Large Page-Page Network | Multivariate | Classification | NA | 22470 | 4714 | 2020 |
| Amphibians | Multivariate | Classification | Integer, Real | 189 | 23 | 2020 |
| Early stage diabetes risk prediction dataset. | Multivariate | Classification | NA | 520 | 17 | 2020 |
| Turkish Spam V01 | Text | Classification | NA | 826 | 2 | 2019 |
| Stock keeping units | Multivariate | Clustering | Integer, Real | 2279 | 9 | 2019 |
| Demand Forecasting for a store | Multivariate | Regression | Integer | 28764 | 8 | 2019 |
| Detect Malware Types | Multivariate, Time-Series, Text | Classification | NA | 7107 | 280 | 2019 |
| Wave Energy Converters | Multivariate | Regression | Real | 288000 | 49 | 2019 |
| Youtube cookery channels viewers comments in Hinglish | Multivariate, Text | Classification | NA | 9800 | 3 | 2019 |
| Pedestrian in Traffic Dataset | Multivariate, Sequential, Time-Series | Classification, Regression, Causal-Discovery | Real | 4760 | 14 | 2019 |
| Cervical Cancer Behavior Risk | Multivariate, Univariate | Classification, Clustering | Integer | 72 | 19 | 2019 |
| Sattriya_Dance_Single_Hand_Gestures Dataset | Multivariate | Classification | NA | 1450 | NA | 2019 |
| Divorce Predictors data set | Multivariate, Univariate | Classification | Integer | 170 | 54 | 2019 |
| 3W dataset | Multivariate, Time-Series | Classification, Clustering | Integer, Real | 1984 | 8 | 2019 |
| Malware static and dynamic features VxHeaven and Virus Total | Multivariate | Classification | Integer, Real | 2955 | 1087 | 2019 |
| Internet Firewall Data | Multivariate | Classification | NA | 65532 | 12 | 2019 |
| User Profiling and Abusive Language Detection Dataset | NA | Classification | NA | 65919 | 3 | 2019 |
| Estimation of obesity levels based on eating habits and physical condition | Multivariate | Classification, Regression, Clustering | Integer | 2111 | 17 | 2019 |
| Rice (Cammeo and Osmancik) | Multivariate | Classification | Real | 3810 | 8 | 2019 |
| Vehicle routing and scheduling problems | Multivariate | Clustering | Integer, Real | 18 | 9 | 2019 |
| Algerian Forest Fires Dataset | Multivariate | Classification, Regression | Real | 244 | 12 | 2019 |
| Breath Metabolomics | Multivariate, Time-Series | Classification, Clustering | Real | 104 | 1656 | 2019 |
| Horton General Hospital | Multivariate, Time-Series | Causal-Discovery | Integer | 139 | 6 | 2019 |
| UrbanGB, urban road accidents coordinates labelled by the urban center | Univariate | Clustering | Real | 360177 | 2 | 2019 |
| Gas Turbine CO and NOx Emission Data Set | Multivariate | Regression, Clustering | Real | 36733 | 11 | 2019 |
| Activity recognition using wearable physiological measurements | Multivariate | Classification | Real | 4480 | 533 | 2019 |
| clickstream data for online shopping | Multivariate, Sequential | Classification, Regression, Clustering | Integer, Real | 165474 | 14 | 2019 |
| CNNpred: CNN-based stock market prediction using a diverse set of variables | Sequential, Time-Series | Classification, Regression | Real | 1985 | 84 | 2019 |
| Apartment for rent classified | Multivariate | Classification, Regression, Clustering | NA | 10000 | 22 | 2019 |
| : Simulated Data set of Iraqi tourism places | Multivariate | Classification, Clustering | NA | 232 | 16 | 2020 |
| Nasarian CAD Dataset | Multivariate | Classification | NA | 150 | 52 | 2020 |
| Monolithic Columns in Troad and Mysia Region | Multivariate | Classification | Real | 11 | 19 | 2020 |
| Bar Crawl: Detecting Heavy Drinking | Multivariate, Time-Series | Classification, Regression | Real | 14057567 | 3 | 2020 |
| Seoul Bike Sharing Demand | Multivariate | Regression | Integer, Real | 8760 | 14 | 2020 |
| Person Classification Gait Data | Multivariate | Classification | Real | 48 | 321 | 2020 |
| Shill Bidding Dataset | Multivariate | Classification, Clustering | NA | 6321 | 13 | 2020 |
| Iranian Churn Dataset | Multivariate | Classification, Regression | Integer | 3150 | 13 | 2020 |
| Unmanned Aerial Vehicle (UAV) Intrusion Detection | Multivariate | Classification | Real | 17256 | 55 | 2020 |
| Bone marrow transplant: children | Multivariate | Classification, Regression | Integer, Real | 187 | 39 | 2020 |
| Exasens | Multivariate | Classification, Clustering | Integer | 399 | 4 | 2020 |
| COVID-19 Surveillance | Multivariate | Classification | NA | 14 | 7 | 2020 |
| Refractive errors | Multivariate | Classification | Integer | 467 | 79 | 2020 |
| Shoulder Implant X-Ray Manufacturer Classification | Multivariate | Classification | Real | 597 | 1 | 2020 |
| CLINC150 | Text | Classification | NA | 23700 | NA | 2020 |
| HCV data | Multivariate | Classification, Clustering | Integer, Real | 615 | 14 | 2020 |
| Taiwanese Bankruptcy Prediction | Multivariate | Classification | Integer | 6819 | 96 | 2020 |
| South German Credit (UPDATE) | Multivariate | Classification, Regression, Clustering | Integer, Real | 1000 | 21 | 2020 |
| IIWA14-R820-Gazebo-Dataset-10Trajectories | NA | Regression | Integer | NA | NA | 2020 |
| Guitar Chords finger positions | Text | Classification | NA | 2633 | 5 | 2020 |
| Russian Corpus of Biographical Texts | Text | Classification | NA | 200 | 2 | 2020 |
| Codon usage | Multivariate | Classification, Clustering | NA | 13028 | 69 | 2020 |
| Intelligent Media Accelerometer and Gyroscope (IM-AccGyro) Dataset | Time-Series | Classification | Real | 800 | 9 | 2020 |
| Myocardial infarction complications | Multivariate | Classification | Real | 1700 | 124 | 2020 |
| Hungarian Chickenpox Cases | Time-Series | Regression | Real | 521 | 20 | 2021 |
| Simulated data for survival modelling | Multivariate, Time-Series | Regression | Integer, Real | 120000 | 25 | 2018 |
| Student Performance on an entrance examination | Multivariate | Classification | NA | 666 | 11 | 2018 |
| Chemical Composition of Ceramic Samples | Multivariate | Classification, Clustering | Real | 88 | 19 | 2019 |
| Labeled Text Forum Threads Dataset | Text | Classification | Integer | 200 | 9 | 2019 |
| Stock keeping units | Multivariate | Clustering | Integer, Real | 2279 | 9 | 2019 |
| BLE RSSI dataset for Indoor localization | Sequential, Time-Series | Classification | Integer | 23570 | 5 | 2019 |
| Basketball dataset | Time-Series | Classification | Integer | 10000 | 7 | 2019 |
| GitHub MUSAE | Multivariate | Classification | NA | 37700 | 4006 | 2019 |
| Anticancer peptides | Sequential | Classification | NA | 1850 | 2 | 2019 |
| Monolithic Columns in Troad and Mysia Region | Multivariate | Classification | Real | 11 | 19 | 2020 |
| Gender by Name | Text | Classification, Clustering | NA | 147270 | 4 | 2020 |
| Iranian Churn Dataset | Multivariate | Classification, Regression | Integer | 3150 | 13 | 2020 |
| Unmanned Aerial Vehicle (UAV) Intrusion Detection | Multivariate | Classification | Real | 17256 | 55 | 2020 |
| Shoulder Implant Manufacture Classification | Multivariate | Classification | NA | 597 | 1 | 2020 |
| LastFM Asia Social Network | Multivariate | Classification | NA | 7624 | 7842 | 2020 |
| Wheat kernels | Multivariate | Classification | Real | 314 | 15 | 2020 |
| Productivity Prediction of Garment Employees | Multivariate, Time-Series | Classification, Regression | Integer, Real | 1197 | 15 | 2020 |
| Multi-view Brain Networks | Multivariate | Classification, Clustering | Integer | 70 | 70 | 2020 |
| LastFM Asia Social Network | Multivariate | Classification | NA | 7624 | 7842 | 2020 |
| Wisesight Sentiment Corpus | Multivariate, Text | Classification | NA | 26737 | 4 | 2020 |
| AI4I 2020 Predictive Maintenance Dataset | Multivariate, Time-Series | Classification, Regression, Causal-Discovery | Real | 10000 | 14 | 2020 |
| Dry Bean Dataset | Multivariate | Classification | Integer, Real | 13611 | 17 | 2020 |
| in-vehicle coupon recommendation | Multivariate | Classification | NA | 12684 | 23 | 2020 |
| Gait Classification | Multivariate | Classification | Real | 48 | 321 | 2020 |
| Wikipedia Math Essentials | Time-Series | Regression | Real | 731 | 1068 | 2021 |
| Wikipedia Math Essentials | Time-Series | Regression | Real | 731 | 1068 | 2021 |
| Synchronous Machine Data Set | Multivariate | Regression | Real | 557 | 5 | 2021 |
auto_mpg<-ucimlr::auto_mpg

knitr::kable(head(auto_mpg,100))%>%
  kableExtra::kable_styling("striped")%>%
  kableExtra::scroll_box(width = "100%",height="300px")
| mpg | cylinders | displacement | horsepower | weight | acceleration | model_year | origin | car_name |
|---|---|---|---|---|---|---|---|---|
| 18 | 8 | 307.0 | 130 | 3504 | 12.0 | 70 | 1 | chevrolet chevelle malibu |
| 15 | 8 | 350.0 | 165 | 3693 | 11.5 | 70 | 1 | buick skylark 320 |
| 18 | 8 | 318.0 | 150 | 3436 | 11.0 | 70 | 1 | plymouth satellite |
| 16 | 8 | 304.0 | 150 | 3433 | 12.0 | 70 | 1 | amc rebel sst |
| 17 | 8 | 302.0 | 140 | 3449 | 10.5 | 70 | 1 | ford torino |
| 15 | 8 | 429.0 | 198 | 4341 | 10.0 | 70 | 1 | ford galaxie 500 |
| 14 | 8 | 454.0 | 220 | 4354 | 9.0 | 70 | 1 | chevrolet impala |
| 14 | 8 | 440.0 | 215 | 4312 | 8.5 | 70 | 1 | plymouth fury iii |
| 14 | 8 | 455.0 | 225 | 4425 | 10.0 | 70 | 1 | pontiac catalina |
| 15 | 8 | 390.0 | 190 | 3850 | 8.5 | 70 | 1 | amc ambassador dpl |
| 15 | 8 | 383.0 | 170 | 3563 | 10.0 | 70 | 1 | dodge challenger se |
| 14 | 8 | 340.0 | 160 | 3609 | 8.0 | 70 | 1 | plymouth ’cuda 340 |
| 15 | 8 | 400.0 | 150 | 3761 | 9.5 | 70 | 1 | chevrolet monte carlo |
| 14 | 8 | 455.0 | 225 | 3086 | 10.0 | 70 | 1 | buick estate wagon (sw) |
| 24 | 4 | 113.0 | 95 | 2372 | 15.0 | 70 | 3 | toyota corona mark ii |
| 22 | 6 | 198.0 | 95 | 2833 | 15.5 | 70 | 1 | plymouth duster |
| 18 | 6 | 199.0 | 97 | 2774 | 15.5 | 70 | 1 | amc hornet |
| 21 | 6 | 200.0 | 85 | 2587 | 16.0 | 70 | 1 | ford maverick |
| 27 | 4 | 97.0 | 88 | 2130 | 14.5 | 70 | 3 | datsun pl510 |
| 26 | 4 | 97.0 | 46 | 1835 | 20.5 | 70 | 2 | volkswagen 1131 deluxe sedan |
| 25 | 4 | 110.0 | 87 | 2672 | 17.5 | 70 | 2 | peugeot 504 |
| 24 | 4 | 107.0 | 90 | 2430 | 14.5 | 70 | 2 | audi 100 ls |
| 25 | 4 | 104.0 | 95 | 2375 | 17.5 | 70 | 2 | saab 99e |
| 26 | 4 | 121.0 | 113 | 2234 | 12.5 | 70 | 2 | bmw 2002 |
| 21 | 6 | 199.0 | 90 | 2648 | 15.0 | 70 | 1 | amc gremlin |
| 10 | 8 | 360.0 | 215 | 4615 | 14.0 | 70 | 1 | ford f250 |
| 10 | 8 | 307.0 | 200 | 4376 | 15.0 | 70 | 1 | chevy c20 |
| 11 | 8 | 318.0 | 210 | 4382 | 13.5 | 70 | 1 | dodge d200 |
| 9 | 8 | 304.0 | 193 | 4732 | 18.5 | 70 | 1 | hi 1200d |
| 27 | 4 | 97.0 | 88 | 2130 | 14.5 | 71 | 3 | datsun pl510 |
| 28 | 4 | 140.0 | 90 | 2264 | 15.5 | 71 | 1 | chevrolet vega 2300 |
| 25 | 4 | 113.0 | 95 | 2228 | 14.0 | 71 | 3 | toyota corona |
| 25 | 4 | 98.0 | NA | 2046 | 19.0 | 71 | 1 | ford pinto |
| 19 | 6 | 232.0 | 100 | 2634 | 13.0 | 71 | 1 | amc gremlin |
| 16 | 6 | 225.0 | 105 | 3439 | 15.5 | 71 | 1 | plymouth satellite custom |
| 17 | 6 | 250.0 | 100 | 3329 | 15.5 | 71 | 1 | chevrolet chevelle malibu |
| 19 | 6 | 250.0 | 88 | 3302 | 15.5 | 71 | 1 | ford torino 500 |
| 18 | 6 | 232.0 | 100 | 3288 | 15.5 | 71 | 1 | amc matador |
| 14 | 8 | 350.0 | 165 | 4209 | 12.0 | 71 | 1 | chevrolet impala |
| 14 | 8 | 400.0 | 175 | 4464 | 11.5 | 71 | 1 | pontiac catalina brougham |
| 14 | 8 | 351.0 | 153 | 4154 | 13.5 | 71 | 1 | ford galaxie 500 |
| 14 | 8 | 318.0 | 150 | 4096 | 13.0 | 71 | 1 | plymouth fury iii |
| 12 | 8 | 383.0 | 180 | 4955 | 11.5 | 71 | 1 | dodge monaco (sw) |
| 13 | 8 | 400.0 | 170 | 4746 | 12.0 | 71 | 1 | ford country squire (sw) |
| 13 | 8 | 400.0 | 175 | 5140 | 12.0 | 71 | 1 | pontiac safari (sw) |
| 18 | 6 | 258.0 | 110 | 2962 | 13.5 | 71 | 1 | amc hornet sportabout (sw) |
| 22 | 4 | 140.0 | 72 | 2408 | 19.0 | 71 | 1 | chevrolet vega (sw) |
| 19 | 6 | 250.0 | 100 | 3282 | 15.0 | 71 | 1 | pontiac firebird |
| 18 | 6 | 250.0 | 88 | 3139 | 14.5 | 71 | 1 | ford mustang |
| 23 | 4 | 122.0 | 86 | 2220 | 14.0 | 71 | 1 | mercury capri 2000 |
| 28 | 4 | 116.0 | 90 | 2123 | 14.0 | 71 | 2 | opel 1900 |
| 30 | 4 | 79.0 | 70 | 2074 | 19.5 | 71 | 2 | peugeot 304 |
| 30 | 4 | 88.0 | 76 | 2065 | 14.5 | 71 | 2 | fiat 124b |
| 31 | 4 | 71.0 | 65 | 1773 | 19.0 | 71 | 3 | toyota corolla 1200 |
| 35 | 4 | 72.0 | 69 | 1613 | 18.0 | 71 | 3 | datsun 1200 |
| 27 | 4 | 97.0 | 60 | 1834 | 19.0 | 71 | 2 | volkswagen model 111 |
| 26 | 4 | 91.0 | 70 | 1955 | 20.5 | 71 | 1 | plymouth cricket |
| 24 | 4 | 113.0 | 95 | 2278 | 15.5 | 72 | 3 | toyota corona hardtop |
| 25 | 4 | 97.5 | 80 | 2126 | 17.0 | 72 | 1 | dodge colt hardtop |
| 23 | 4 | 97.0 | 54 | 2254 | 23.5 | 72 | 2 | volkswagen type 3 |
| 20 | 4 | 140.0 | 90 | 2408 | 19.5 | 72 | 1 | chevrolet vega |
| 21 | 4 | 122.0 | 86 | 2226 | 16.5 | 72 | 1 | ford pinto runabout |
| 13 | 8 | 350.0 | 165 | 4274 | 12.0 | 72 | 1 | chevrolet impala |
| 14 | 8 | 400.0 | 175 | 4385 | 12.0 | 72 | 1 | pontiac catalina |
| 15 | 8 | 318.0 | 150 | 4135 | 13.5 | 72 | 1 | plymouth fury iii |
| 14 | 8 | 351.0 | 153 | 4129 | 13.0 | 72 | 1 | ford galaxie 500 |
| 17 | 8 | 304.0 | 150 | 3672 | 11.5 | 72 | 1 | amc ambassador sst |
| 11 | 8 | 429.0 | 208 | 4633 | 11.0 | 72 | 1 | mercury marquis |
| 13 | 8 | 350.0 | 155 | 4502 | 13.5 | 72 | 1 | buick lesabre custom |
| 12 | 8 | 350.0 | 160 | 4456 | 13.5 | 72 | 1 | oldsmobile delta 88 royale |
| 13 | 8 | 400.0 | 190 | 4422 | 12.5 | 72 | 1 | chrysler newport royal |
| 19 | 3 | 70.0 | 97 | 2330 | 13.5 | 72 | 3 | mazda rx2 coupe |
| 15 | 8 | 304.0 | 150 | 3892 | 12.5 | 72 | 1 | amc matador (sw) |
| 13 | 8 | 307.0 | 130 | 4098 | 14.0 | 72 | 1 | chevrolet chevelle concours (sw) |
| 13 | 8 | 302.0 | 140 | 4294 | 16.0 | 72 | 1 | ford gran torino (sw) |
| 14 | 8 | 318.0 | 150 | 4077 | 14.0 | 72 | 1 | plymouth satellite custom (sw) |
| 18 | 4 | 121.0 | 112 | 2933 | 14.5 | 72 | 2 | volvo 145e (sw) |
| 22 | 4 | 121.0 | 76 | 2511 | 18.0 | 72 | 2 | volkswagen 411 (sw) |
| 21 | 4 | 120.0 | 87 | 2979 | 19.5 | 72 | 2 | peugeot 504 (sw) |
| 26 | 4 | 96.0 | 69 | 2189 | 18.0 | 72 | 2 | renault 12 (sw) |
| 22 | 4 | 122.0 | 86 | 2395 | 16.0 | 72 | 1 | ford pinto (sw) |
| 28 | 4 | 97.0 | 92 | 2288 | 17.0 | 72 | 3 | datsun 510 (sw) |
| 23 | 4 | 120.0 | 97 | 2506 | 14.5 | 72 | 3 | toyouta corona mark ii (sw) |
| 28 | 4 | 98.0 | 80 | 2164 | 15.0 | 72 | 1 | dodge colt (sw) |
| 27 | 4 | 97.0 | 88 | 2100 | 16.5 | 72 | 3 | toyota corolla 1600 (sw) |
| 13 | 8 | 350.0 | 175 | 4100 | 13.0 | 73 | 1 | buick century 350 |
| 14 | 8 | 304.0 | 150 | 3672 | 11.5 | 73 | 1 | amc matador |
| 13 | 8 | 350.0 | 145 | 3988 | 13.0 | 73 | 1 | chevrolet malibu |
| 14 | 8 | 302.0 | 137 | 4042 | 14.5 | 73 | 1 | ford gran torino |
| 15 | 8 | 318.0 | 150 | 3777 | 12.5 | 73 | 1 | dodge coronet custom |
| 12 | 8 | 429.0 | 198 | 4952 | 11.5 | 73 | 1 | mercury marquis brougham |
| 13 | 8 | 400.0 | 150 | 4464 | 12.0 | 73 | 1 | chevrolet caprice classic |
| 13 | 8 | 351.0 | 158 | 4363 | 13.0 | 73 | 1 | ford ltd |
| 14 | 8 | 318.0 | 150 | 4237 | 14.5 | 73 | 1 | plymouth fury gran sedan |
| 13 | 8 | 440.0 | 215 | 4735 | 11.0 | 73 | 1 | chrysler new yorker brougham |
| 12 | 8 | 455.0 | 225 | 4951 | 11.0 | 73 | 1 | buick electra 225 custom |
| 13 | 8 | 360.0 | 175 | 3821 | 11.0 | 73 | 1 | amc ambassador brougham |
| 18 | 6 | 225.0 | 105 | 3121 | 16.5 | 73 | 1 | plymouth valiant |
| 16 | 6 | 250.0 | 100 | 3278 | 18.0 | 73 | 1 | chevrolet nova custom |
| 18 | 6 | 232.0 | 100 | 2945 | 16.0 | 73 | 1 | amc hornet |
The model
auto_mpg<-na.omit(auto_mpg)

set.seed(1)
#lets split the data 60/40
library(caret)
trainIndex <- createDataPartition(auto_mpg$mpg, p = .6, list = FALSE, times = 1)

#grab the data
mpgTrain <- auto_mpg[ trainIndex,]
mpgTest  <- auto_mpg[-trainIndex,]

mpggbm<- train(
  form = mpg ~ cylinders+displacement+horsepower+weight+acceleration+factor(model_year)+factor(origin),
  data = mpgTrain,
  #here we add classProbs because we want probs
  trControl = trainControl(method = "cv", number = 10),
  method = "gbm",
  tuneLength = 10,
  verbose=FALSE)

knitr::kable(mpggbm$bestTune)
| n.trees | interaction.depth | shrinkage | n.minobsinnode | |
|---|---|---|---|---|
| 6 | 300 | 1 | 0.1 | 10 |
summary(mpggbm)
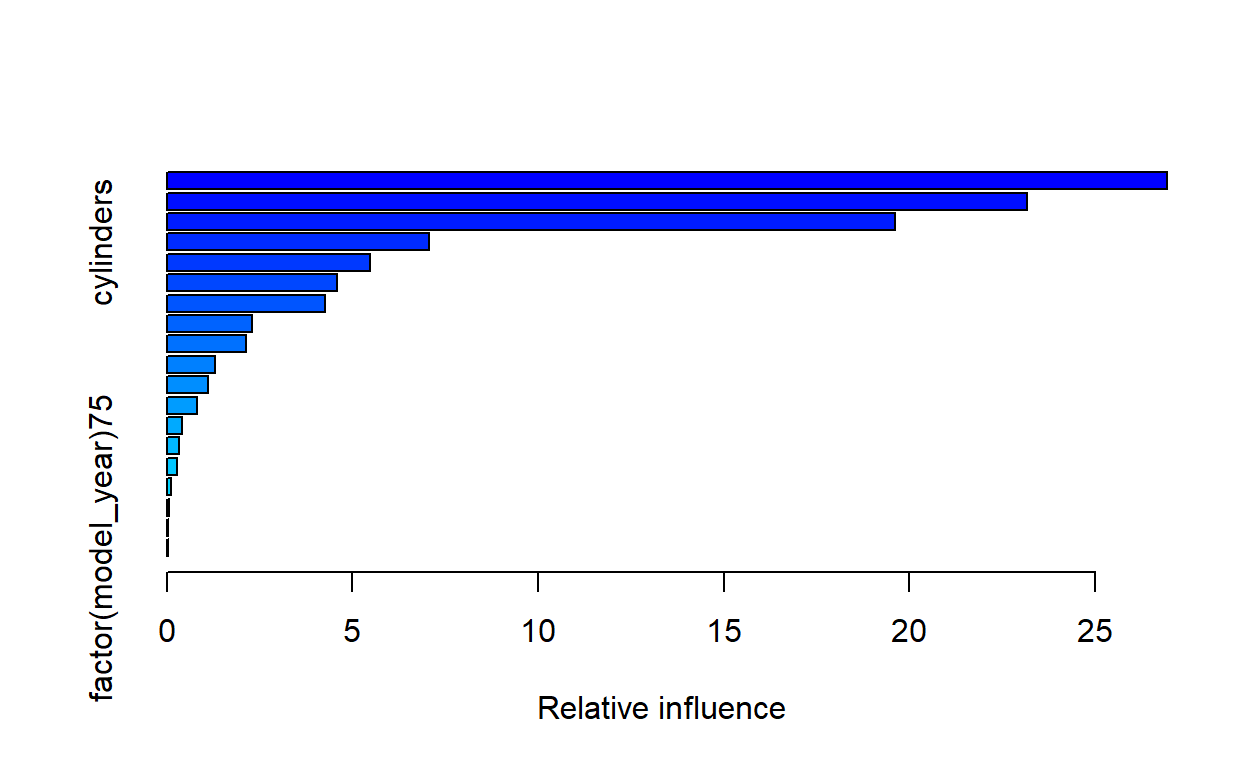
                                      var     rel.inf
displacement                 displacement 26.94621833
weight                             weight 23.17435112
horsepower                     horsepower 19.63108746
cylinders                       cylinders  7.06435813
factor(model_year)82 factor(model_year)82  5.46316709
factor(model_year)80 factor(model_year)80  4.57983291
acceleration                 acceleration  4.26451329
factor(model_year)81 factor(model_year)81  2.30193941
factor(model_year)73 factor(model_year)73  2.14169961
factor(model_year)79 factor(model_year)79  1.28966117
factor(model_year)72 factor(model_year)72  1.10759434
factor(origin)3           factor(origin)3  0.80155769
factor(origin)2           factor(origin)2  0.40108307
factor(model_year)78 factor(model_year)78  0.33288986
factor(model_year)74 factor(model_year)74  0.25780334
factor(model_year)76 factor(model_year)76  0.12238033
factor(model_year)71 factor(model_year)71  0.05678884
factor(model_year)77 factor(model_year)77  0.03278255
factor(model_year)75 factor(model_year)75 0.03029146mpggbm_Pred<-predict(mpggbm,mpgTest)
knitr::kable(mpggbm_Pred)%>%
kableExtra::kable_styling("striped")%>%
kableExtra::scroll_box(width = "50%",height="300px")
| x |
|---|
| 17.22115 |
| 17.64381 |
| 14.93228 |
| 14.93228 |
| 15.09813 |
| 16.24625 |
| 16.39585 |
| 17.92315 |
| 19.77060 |
| 22.58967 |
| 24.99121 |
| 25.92369 |
| 14.10710 |
| 13.93441 |
| 17.91073 |
| 17.31234 |
| 15.08089 |
| 27.26531 |
| 24.03732 |
| 33.31186 |
| 31.93535 |
| 13.32985 |
| 12.79194 |
| 13.49570 |
| 14.52023 |
| 12.79194 |
| 24.74133 |
| 24.65089 |
| 28.73584 |
| 22.01284 |
| 25.18892 |
| 24.72307 |
| 12.27333 |
| 12.10748 |
| 12.12382 |
| 11.56958 |
| 18.26998 |
| 11.17757 |
| 11.71917 |
| 11.56958 |
| 24.56904 |
| 23.46576 |
| 19.89709 |
| 22.25626 |
| 12.27333 |
| 11.95788 |
| 27.59018 |
| 19.77070 |
| 14.45734 |
| 20.47107 |
| 17.63908 |
| 31.21116 |
| 25.62049 |
| 15.67514 |
| 16.55074 |
| 14.77456 |
| 14.24669 |
| 26.82490 |
| 34.65491 |
| 30.39243 |
| 17.44486 |
| 14.03970 |
| 18.16763 |
| 18.10036 |
| 23.89661 |
| 30.10882 |
| 30.04516 |
| 18.47023 |
| 15.27834 |
| 15.14153 |
| 15.03680 |
| 17.34817 |
| 20.87879 |
| 18.65120 |
| 31.71094 |
| 30.04482 |
| 31.30393 |
| 16.34144 |
| 16.39732 |
| 28.19232 |
| 21.07537 |
| 14.99837 |
| 20.53874 |
| 22.23192 |
| 29.89433 |
| 15.47921 |
| 14.93761 |
| 15.78728 |
| 19.24194 |
| 26.35599 |
| 24.39282 |
| 27.53039 |
| 32.07788 |
| 26.67017 |
| 27.60152 |
| 24.18956 |
| 24.61794 |
| 33.41975 |
| 28.74166 |
| 33.45902 |
| 32.15866 |
| 16.99719 |
| 21.86984 |
| 19.34578 |
| 18.41856 |
| 18.01985 |
| 27.25457 |
| 23.70732 |
| 26.08560 |
| 22.73485 |
| 21.74154 |
| 23.47636 |
| 21.02211 |
| 17.33256 |
| 17.78127 |
| 34.31357 |
| 28.16170 |
| 27.53156 |
| 17.92389 |
| 26.97398 |
| 32.70180 |
| 23.68881 |
| 27.85709 |
| 24.62995 |
| 32.11614 |
| 28.46064 |
| 31.50306 |
| 33.01996 |
| 38.21091 |
| 27.87489 |
| 30.16567 |
| 34.03440 |
| 35.77455 |
| 29.21421 |
| 33.76378 |
| 28.33990 |
| 29.30736 |
| 29.33523 |
| 35.57827 |
| 35.17441 |
| 37.26067 |
| 33.32268 |
| 35.60199 |
| 33.24434 |
| 25.95727 |
| 27.02805 |
| 26.75234 |
| 31.97432 |
| 28.87719 |
| 33.70910 |
| 38.26585 |
| 35.08431 |
| 26.15340 |
| 30.58842 |
| 32.14702 |
mpggbmtestpred<-cbind(mpggbm_Pred,mpgTest)

#root mean squared error
RMSE(mpggbmtestpred$mpggbm_Pred,mpggbmtestpred$mpg)
[1] 2.966667#best measure ever...RSquared
cor(mpggbmtestpred$mpggbm_Pred,mpggbmtestpred$mpg)^2
[1] 0.8578063install.packages("pdp")
Gradient Tree Boosting: Partial Dependence
The feature importance shown earlier provides an indication of the relative importance of the different features, for either classification or regression. An alternate approach to understanding the relationship between features and their importance involves the construction of partial dependence plots. These plots show the dependence between the regression model and a specific set of features, selected from the set of all features used to build the regression model. To calculate this dependence, we marginalize over all of the other features, so that the effect of the target feature (or features) is measured. Generally, this set is restricted to a small number, such as one or two, since it becomes hard to visualize larger relationships.
pdp::partial(mpggbm, pred.var = "cylinders", plot = TRUE, rug = TRUE,
              plot.engine = "ggplot2")
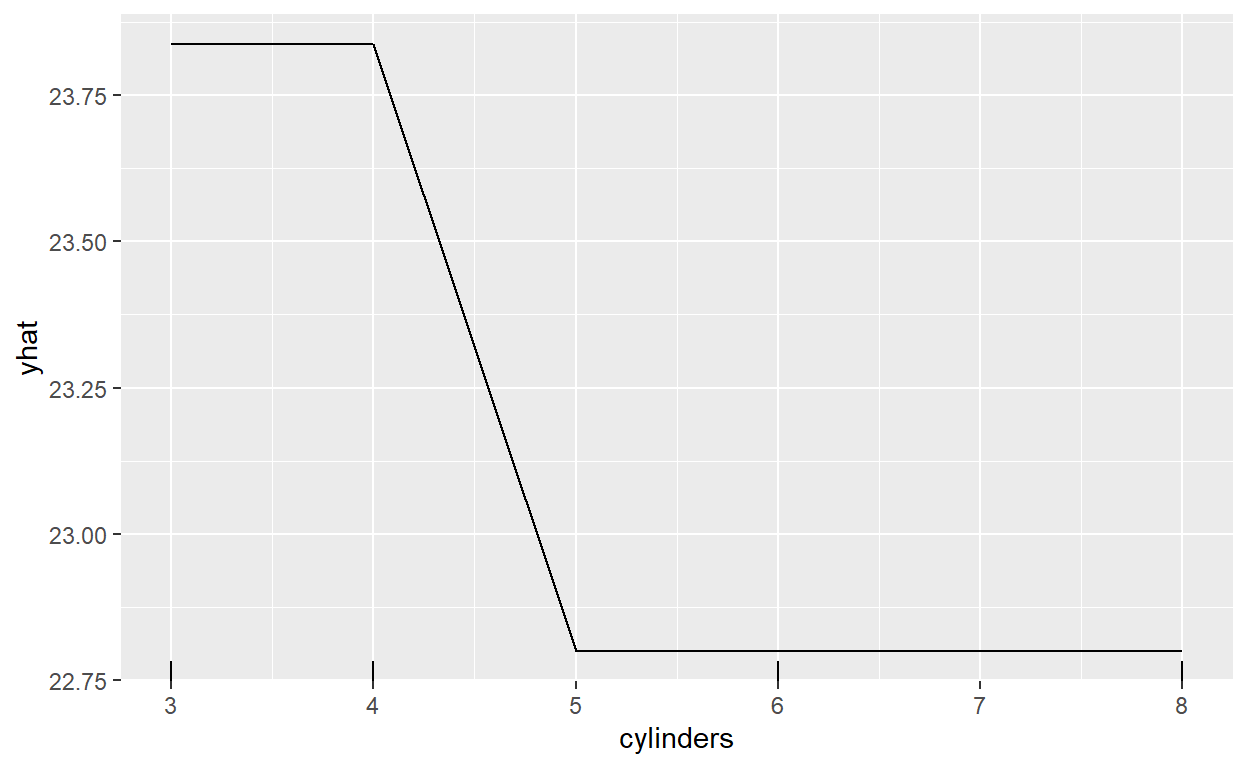
gridExtra::grid.arrange(
  pdp::partial(mpggbm, pred.var = "cylinders", plot = TRUE, rug = TRUE,
              plot.engine = "ggplot2"),
  pdp::partial(mpggbm, pred.var = "displacement", plot = TRUE, rug = TRUE,
              plot.engine = "ggplot2"),
  ncol = 2
)
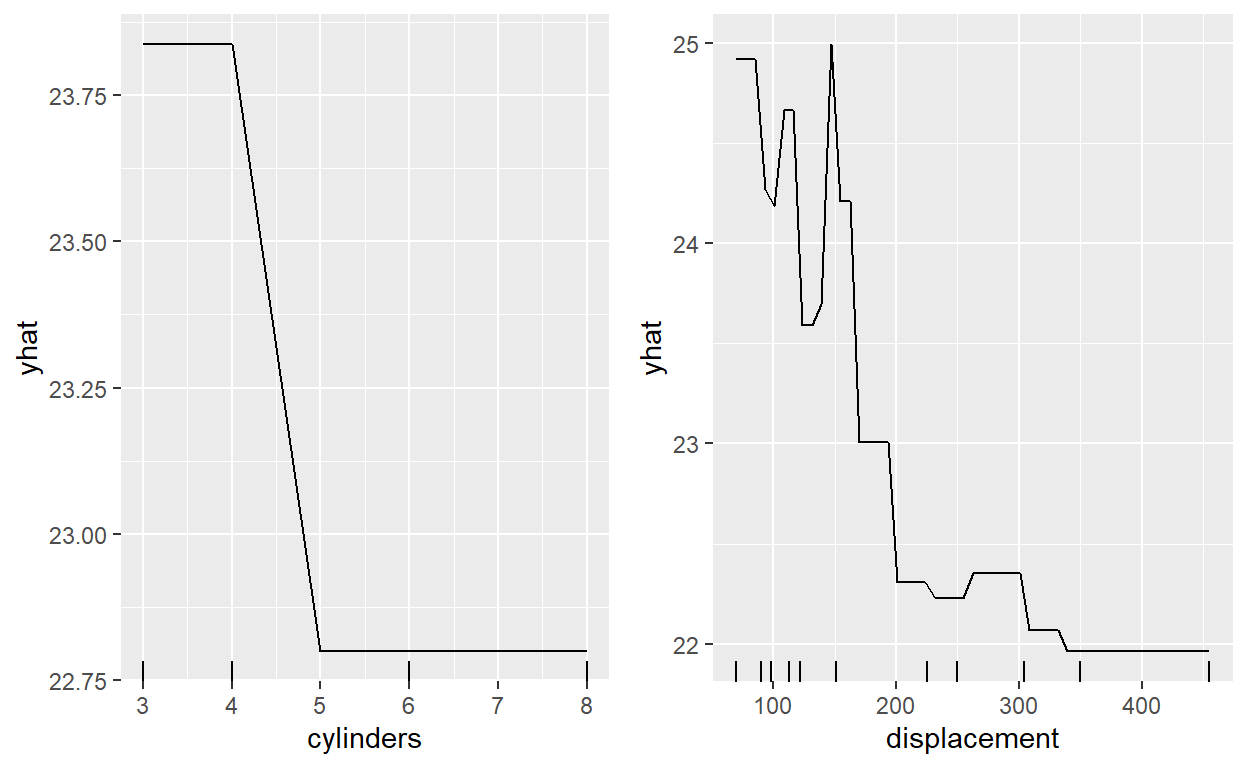
  pdp::partial(mpggbm, pred.var = c("cylinders","displacement"), plot = TRUE, rug = TRUE,
              plot.engine = "ggplot2")
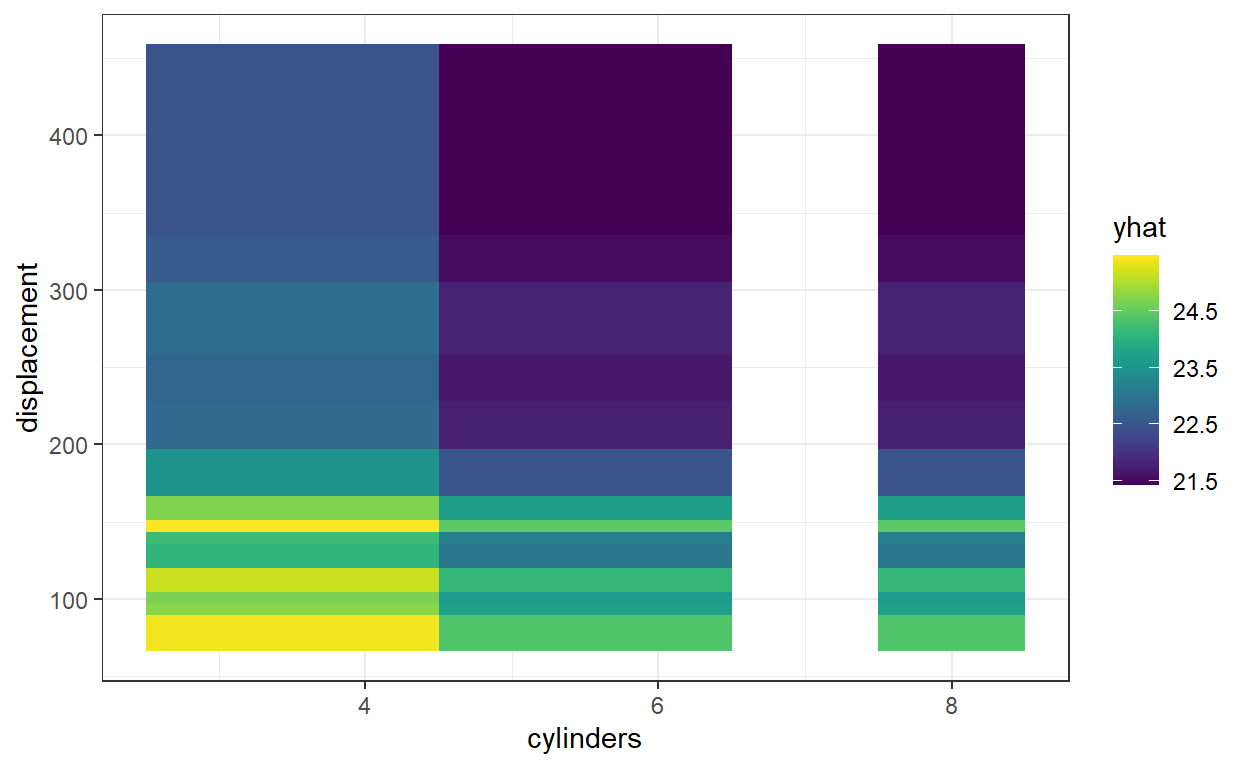
# Compute partial dependence data for lstat and rm
pd <- pdp::partial(mpggbm, pred.var = c("weight","displacement"))

# Default PDP
pdp::plotPartial(pd)
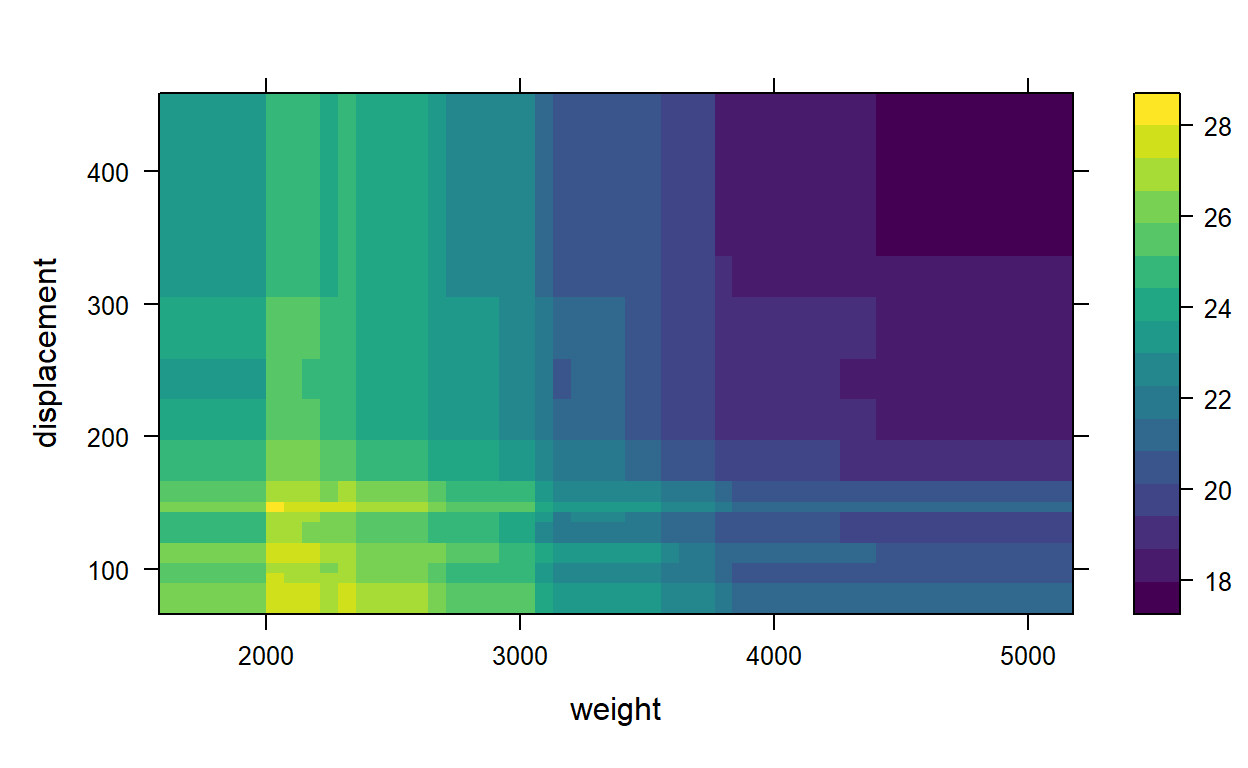
# Add contour lines and use a different color palette
rwb <- colorRampPalette(c("darkred", "white", "pink"))
pdp::plotPartial(pd, contour = TRUE, col.regions = rwb)
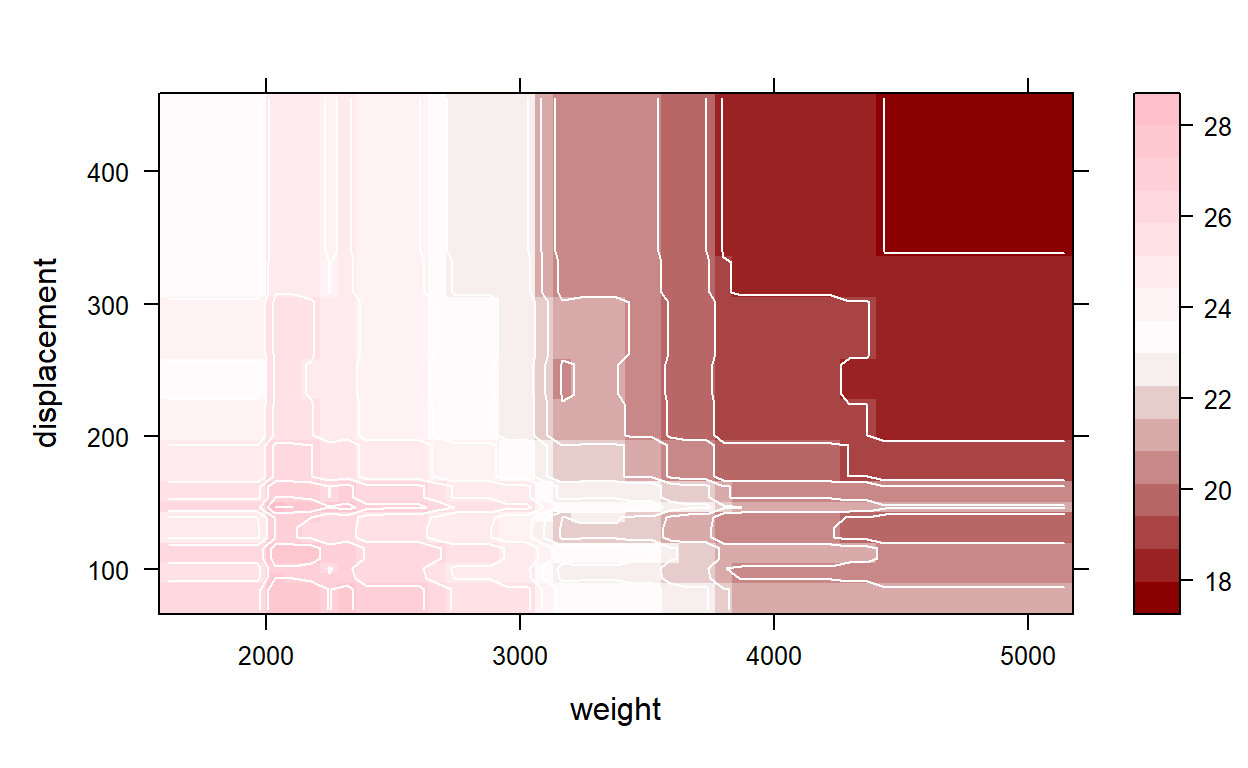
# 3-D surface
pdp::plotPartial(pd, levelplot = FALSE, zlab = "mpg", colorkey = TRUE,
                    screen = list(z = -20, x = -60))
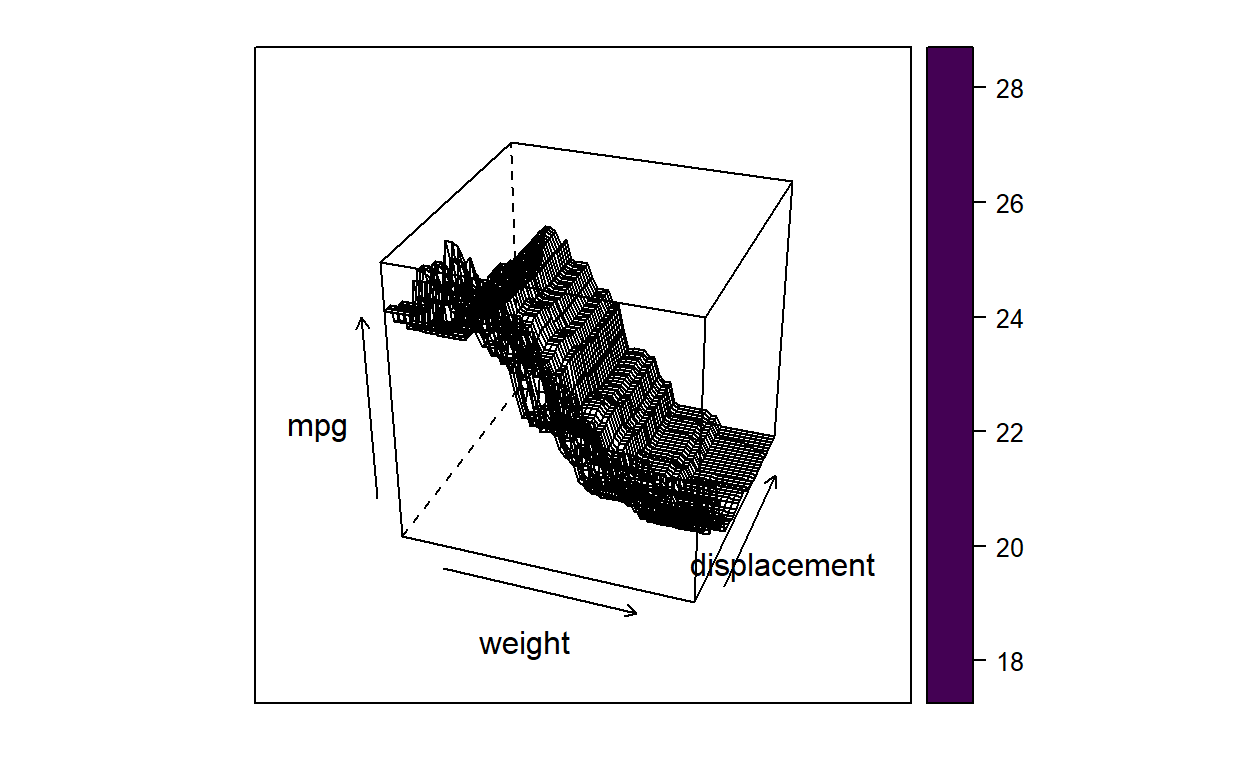
#install.packages("akima")
###### Interactive 3D partial dependence plot with coloring scale ######

# Interpolate the partial dependence values
dens <- akima::interp(x = pd$weight, y = pd$displacement, z = pd$yhat)

# 3D partial dependence plot with a coloring scale
p3 <- plotly::plot_ly(x = dens$x,
          y = dens$y,
          z = dens$z,
          colors = c("blue", "grey", "red"),
          type = "surface")
# Add axis labels for 3D plots

p3 <- p3%>% plotly::layout(scene = list(xaxis = list(title = 'Weight'),
                     yaxis = list(title = 'Displacement'),
                     zaxis = list(title = 'Predicted Mpg')))
# Show the plot
p3
Adaboost
We now turn our attention to the second boosting algorithm presented in this module, Adaboost, which is short for Adaptive Boosting. Adaboost was an early boosting algorithm that iteratively adjusts the weights on the training data to improve the performance of the ensemble algorithm. The weights are adjusted on each iteration to increase the predictive accuracy on the incorrectly predicted training data.
set.seed(1)
#lets split the data 60/40
iris2<-iris%>%
  filter(Species!="versicolor")
iris2$Species<-factor(iris2$Species)

library(caret)
trainIndex <- createDataPartition(iris2$Species, p = .6, list = FALSE, times = 1)

#grab the data
irisTrain <- iris2[ trainIndex,]
irisTest  <- iris2[-trainIndex,]

#added something here
Irisadaboost<- train(
  form = factor(Species) ~ .,
  data = irisTrain,
  #here we add classProbs because we want probs
  trControl = trainControl(method = "cv", number = 10,
                           classProbs =  TRUE),
  method = "adaboost",
  tuneLength = 5,
  #add this please
  verbose=FALSE)

#Irisadaboost
knitr::kable(Irisadaboost$bestTune)
| nIter | method |
|---|---|
| 50 | Adaboost.M1 |
plot(Irisadaboost)
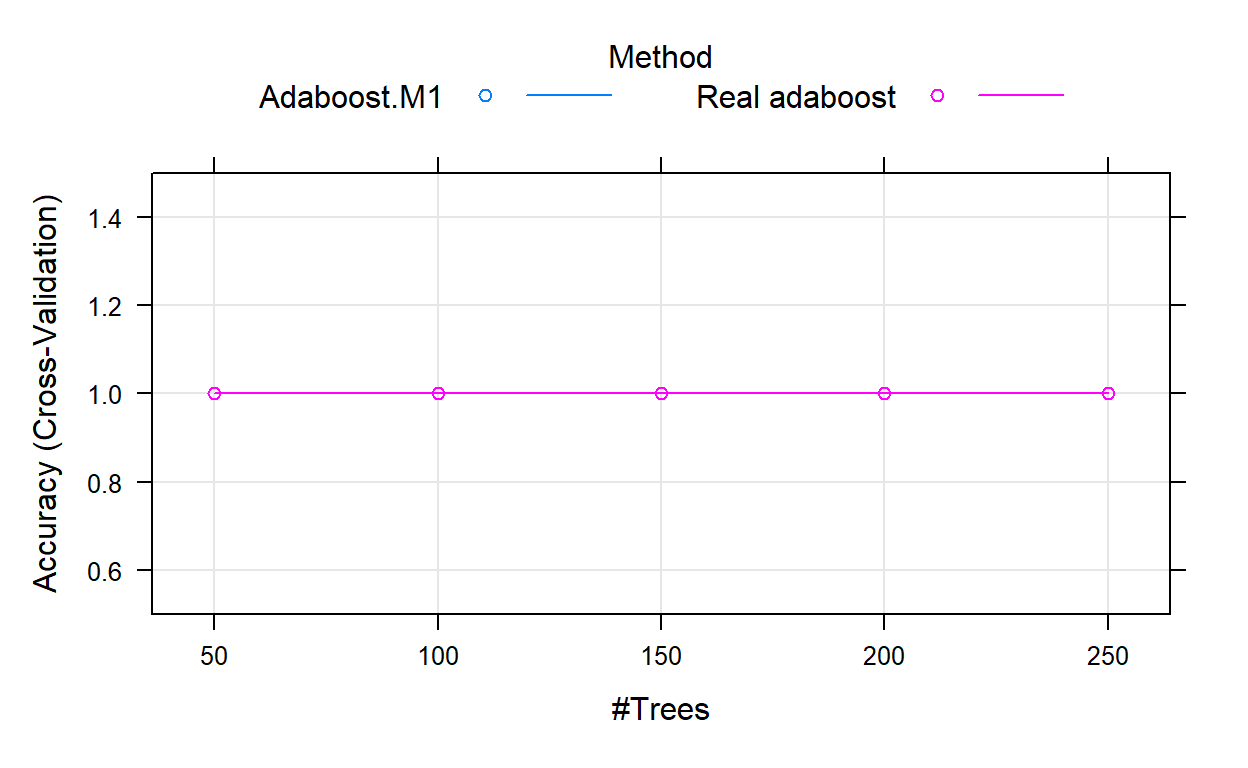
Irisadaboost_Pred<-predict(Irisadaboost,irisTest,type="prob")

knitr::kable(Irisadaboost_Pred)%>%
  kableExtra::kable_styling("striped")%>%
  kableExtra::scroll_box(width = "50%",height="300px")
| setosa | virginica |
|---|---|
| 1 | 0 |
| 1 | 0 |
| 1 | 0 |
| 1 | 0 |
| 1 | 0 |
| 1 | 0 |
| 1 | 0 |
| 1 | 0 |
| 1 | 0 |
| 1 | 0 |
| 1 | 0 |
| 1 | 0 |
| 1 | 0 |
| 1 | 0 |
| 1 | 0 |
| 1 | 0 |
| 1 | 0 |
| 1 | 0 |
| 1 | 0 |
| 1 | 0 |
| 0 | 1 |
| 0 | 1 |
| 0 | 1 |
| 0 | 1 |
| 0 | 1 |
| 0 | 1 |
| 0 | 1 |
| 0 | 1 |
| 0 | 1 |
| 0 | 1 |
| 0 | 1 |
| 0 | 1 |
| 0 | 1 |
| 0 | 1 |
| 0 | 1 |
| 0 | 1 |
| 0 | 1 |
| 0 | 1 |
| 0 | 1 |
| 0 | 1 |
irisadaboosttestpred<-cbind(Irisadaboost_Pred,irisTest)

irisadaboosttestpred<-irisadaboosttestpred%>%
  mutate(prediction=if_else(setosa>virginica,"setosa",
                            if_else(virginica>setosa,"virginica", "PROBLEM")))

table(irisadaboosttestpred$prediction)
   setosa virginica
20 20 adaboostConfusion<-confusionMatrix(factor(irisadaboosttestpred$prediction),factor(irisadaboosttestpred$Species))
adaboostConfusion
Confusion Matrix and Statistics

           Reference
Prediction  setosa virginica
  setosa        20         0
  virginica      0        20

               Accuracy : 1
                 95% CI : (0.9119, 1)
    No Information Rate : 0.5
    P-Value [Acc > NIR] : 9.095e-13

                  Kappa : 1

 Mcnemar's Test P-Value : NA

            Sensitivity : 1.0
            Specificity : 1.0
         Pos Pred Value : 1.0
         Neg Pred Value : 1.0
             Prevalence : 0.5
         Detection Rate : 0.5
   Detection Prevalence : 0.5
      Balanced Accuracy : 1.0

       'Positive' Class : setosa